

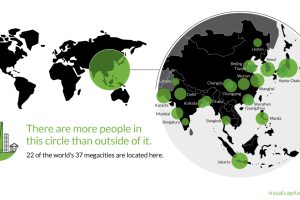
That’s right – nearly 4 billion people live inside the circle on this world map, including 22 of the world’s 37 megacities. Read more
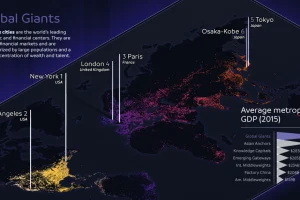
The world’s largest 123 cities generate an astonishing $36 trillion in GDP per year. This infographic breaks these global cities down into seven typologies. Read more
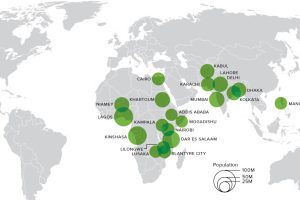
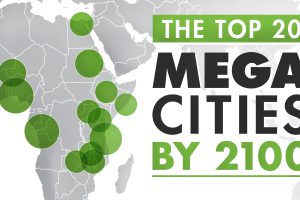
This animation shows big changes in the world’s most populous cities over the next 80+ years. Africa alone will hold 13 cities bigger than NYC by this time. Read more
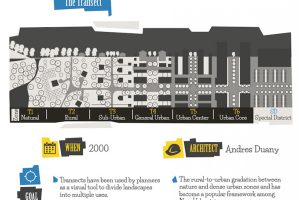
From garden cities to psychogeography, the 20th century saw a number of bold ideas that radically changed urban planning. Read more
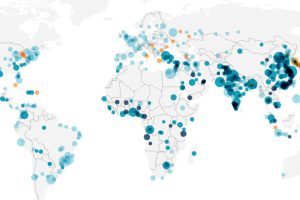
Interactive map showing 500 cities with over 1M+ inhabitants, sorted by growth rate from 2000-2016. Use it to find the fastest growing cities in the world. Read more
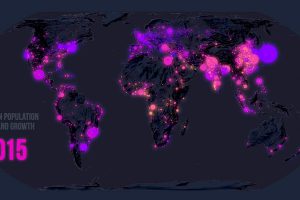
The world’s population centers are shifting rapidly, and by 2100, it is projected that the world’s largest megacities will exceed 70 million people. Read more
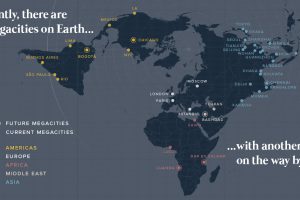
There are currently 33 megacities in the world with over 10 million inhabitants – but by 2030, there will be six new megacities, including one in the U.S. Read more
Few global trends have matched the profound impact of urbanization. Today’s map looks back at 70 years of movement in over 1,800 cities. Read more

Today’s stunning map ranks the world’s most powerful megaregions — together, they contribute a whopping $28 trillion to the global economy. Read more
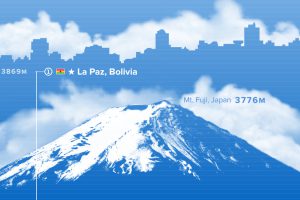
Where are the world’s highest cities? This graphic ranks the world’s major urban centers by altitude above sea level. Read more