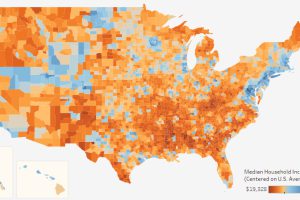
This interactive data visualization allows you to see median household income levels for every U.S. county – as well as the ability to sort data by state. Read more

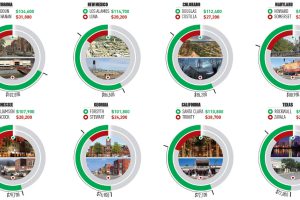
This infographic uses the measure of median household income to contrast the wealthiest and poorest counties in every U.S. state. Read more

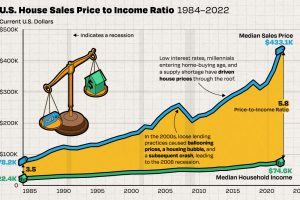
We chart the ever-widening gap between median incomes and the median price of houses in America, using data from the Federal Reserve from 1984 to 2022. Read more

