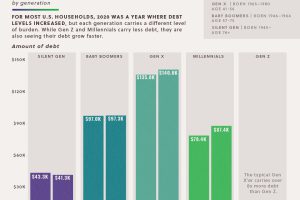
The majority of U.S. households saw debts rise in 2020. This data looks at the growth in household debt and the existing debt pile, by generation Read more
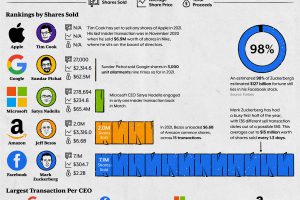
Big Tech is worth trillions, but what are insiders doing with their stock? We breakdown Big Tech CEO insider trading during the first half of 2021. Read more

Corporate finance oversees trillions of dollars and makes modern markets and economies possible, but who are the main players? Read more
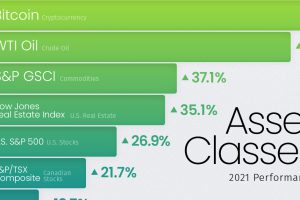
2021 was a strong year for stocks, commodities, and cryptocurrencies, as most asset classes provided positive returns. Read more

Amazon’s shipping costs have surged to over $150 billion – a number that has almost doubled since the start of the pandemic. Read more

America is home to the most billionaires in the world. But which billionaire is the richest in each state? Read more

From the wealth held to billionaires to all debt in the global financial system, we look at the vast universe of money and markets in 2022. Read more
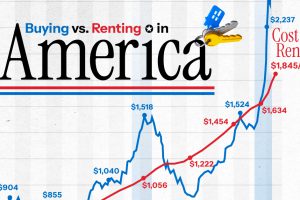
The U.S. has witnessed the biggest numerical gap in the monthly cost between buying a home and renting in over 50 years. Read more


