

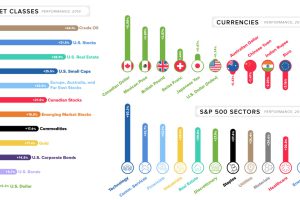
This quick graphic summary breaks down the final market numbers for 2019, looking at everything from currencies to broad asset classes. Read more
The U.S. stock market had a banner year, but some sectors were notable outliers. Here are the ones that outperformed (and underperformed) in 2019. Read more

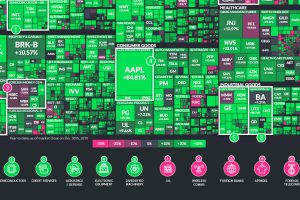
In the pandemic economy, the soup, toilet paper, and bleach companies are reigning supreme. See the stocks that have avoided the bug. Read more
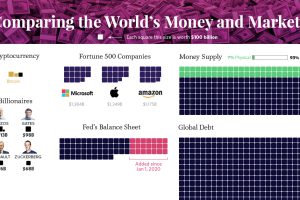
Our most famous visualization, updated for 2020 to show all global debt, wealth, money, and assets in one massive and mind-bending chart. Read more
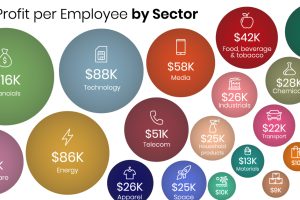
The U.S. companies on the Fortune 500 boast $1.2 trillion in combined profit—but which bring in the best and worst profit per employee? Read more
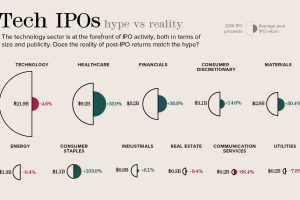
Technology IPOs draw massive investor and media attention, sometimes raising billions of dollars. But do tech IPO returns match up with the hype? Read more

Nearly half the world has tapped into the social media universe. Monthly Active Users (MAUs) quantifies the success of these giant platforms. Read more

The Dow Jones Industrial Average is constantly evolving. This chart tracks which companies have come and gone since the inception of the index in 1928. Read more

Podcasting is now a billion dollar industry, attracting big names and audiences to match. Here’s a global look at the top podcasts on Spotify. Read more
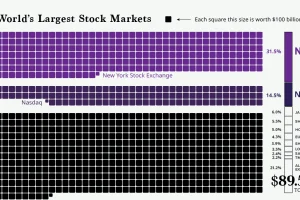
The world’s stock market exchanges have a combined market cap of $89.5 trillion, with American exchanges making up all most half that value. Read more