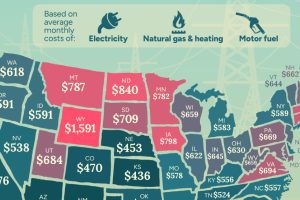
Three states concentrate almost half of unauthorized immigrants. Read more
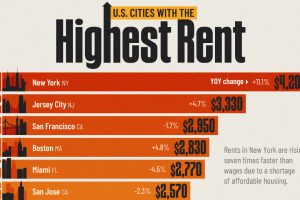
NYC tops the list with an average monthly cost of $4,200 for a one-bedroom apartment. Read more

A single adult needs to make at least $116k annually to live comfortably in Massachusetts. Read more
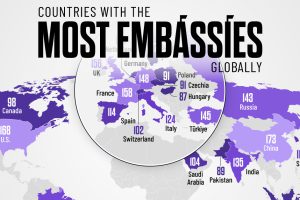
The Global Diplomacy Index attempts to quantify and compare diplomatic networks by ranking countries with the most embassies worldwide. Read more
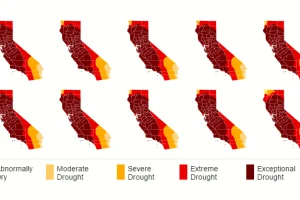
California has been the victim of years of drought now, and this data visualization series shows the cumulative effects. Read more
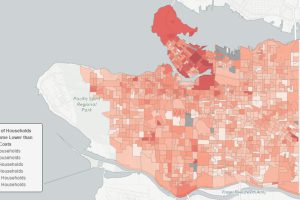
This series of images overlays data on the affordability of housing onto maps of Vancouver, the epicenter of Canada’s housing bubble. Read more
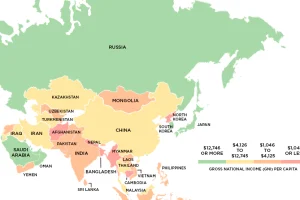
This series of maps uses data on Gross National Income (GNI) to classify the world’s richest and poorest countries based on four income groups. Read more
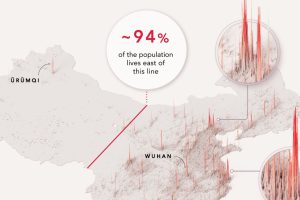
1.4 billion people live in a country stretching across 3.7 million square miles. Yet 94% of China’s population lives in only one half. Read more

Like the stock market, the greatest empires in history have been cyclical in nature. We look at their rise and fall, and the lessons we can learn as investors. Read more


