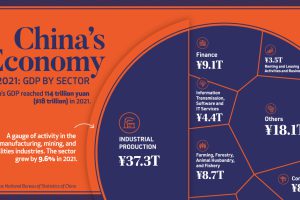
China’s economy reached a GDP of 114 trillion yuan ($18 trillion) in 2021, well above government targets. What sectors drove that growth? Read more

The supply chain is key for the renewable energy revolution, and this chart visualizes where the world’s solar panels are manufactured. Read more

It takes Poland, Sweden, Austria, Norway, and 18 other countries together to match the might of Germany’s economy. Read more

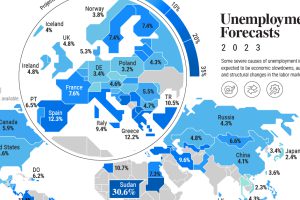
Unemployment is forecast to tick higher in 2023, but so far red-hot labor markets are resisting this trend on a global scale. Read more

Key sectors in the U.S.—including Leisure and Health Social Services—are projected to be the fastest growing industries over the next decade. Read more

We look at the share of Asian companies in the top 3,000 global firms—measured by market capitalization in 2020—broken down by industry. Read more

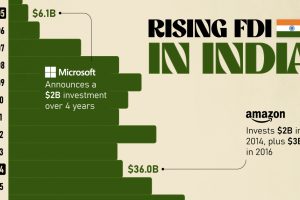
Mirroring the country’s rapid economic growth, India’s FDI (foreign direct investment) inflows have skyrocketed over the last twenty years. Read more

Global inflation projections look optimistic in 2024, but risks of a second wave of price pressures remain due to geopolitical shocks. Read more

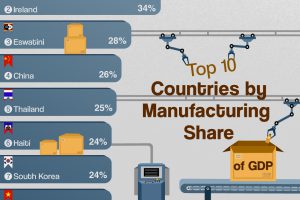
On opposite sides of the Atlantic, Ireland and Puerto Rico share a common industry where manufacturing still plays a key role Read more

