


The Most Expensive Takeovers in 11 Industries This handy infographic documents the largest mergers and acquisitions (M&A) in 11 major industries. With the data visualized, perhaps the most striking element… Read more
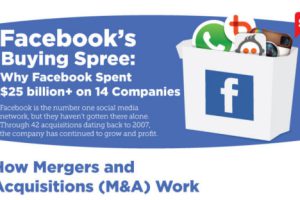
Facebook has spent over $25B on 14 companies over the last few years. Read more
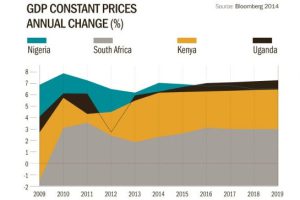
Despite declining commodity prices and the outbreak of Ebola, investors are still betting on Africa. Read more
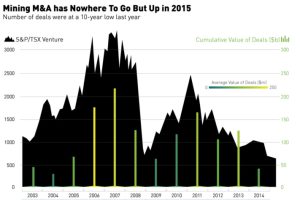
This week’s chart shows the volume, average value, and cumulative value of mining M&A deals against overall market performance. Read more
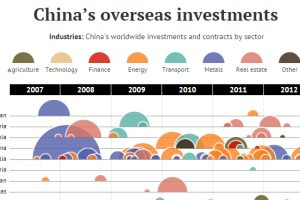
In this data visualization, every attempted Chinese overseas investment over $100 million is organized by country and sector. Read more
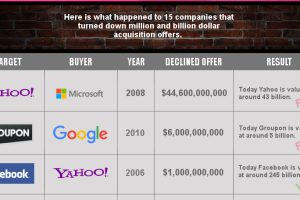
Here’s 15 technology startups that turned down big acquisition offers, and how the decisions look in retrospect. Read more
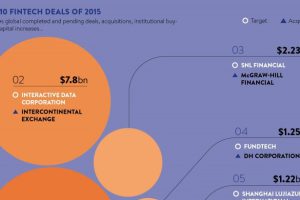
The fintech sector has been on fire lately. In today’s infographic, we look back on the sector in 2015 to review the 10 biggest fintech deals of the year. Read more

How is Amazon building a massive online store that is everything to everyone? Look no further than the list of Amazon’s biggest acquisitions for the answer. Read more
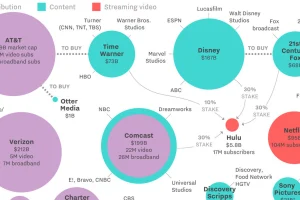
Pressure from platforms has forced big media conglomerates to make massive bets, such as Disney’s deal with 21st Century Fox. See the changing landscape in this visualization. Read more
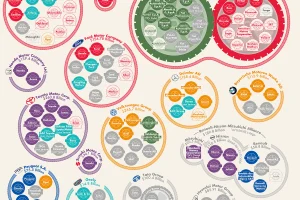
This massive infographic shows the 15 corporations that make the most cars, their annual revenues, and the brands owned by each automaker. Read more