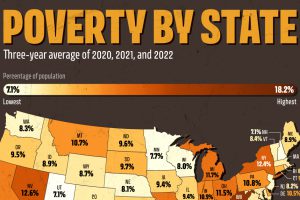
U.S. poverty rates were relatively higher in the South, compared to northern states. Which states saw the highest rates in 2022? Read more

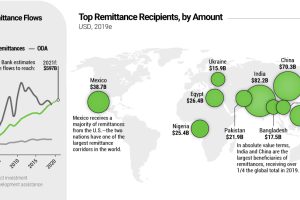
Every year, migrant workers send billions of dollars back to their home countries—reaching $550 billion in 2019. Where do these remittance flows wind up? Read more

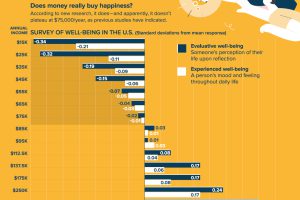
We’ve heard that money can only buy happiness up to a certain point. But a new study suggests cut-off may be a lot higher than we thought. Read more

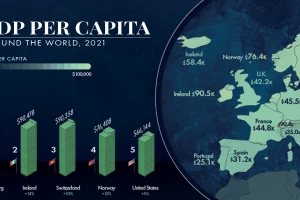
GDP per capita is one of the best measures of a country’s standard of living. This map showcases the GDP per capita in every country globally. Read more

