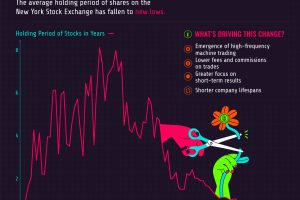
The average holding period of shares on the New York Stock Exchange (NYSE) is now less than one year. Read more
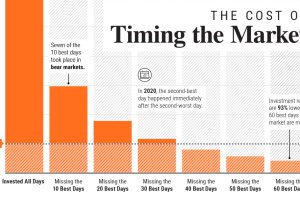
In this graphic, we show why timing the market is extremely difficult, and how it can meaningfully dent portfolio returns. Read more
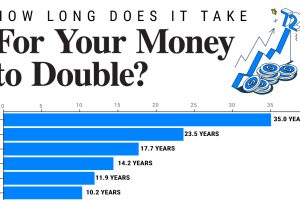
Since 1949, the S&P 500 has doubled in value 10 times. We show how long it takes to double your money across a range of annualized returns. Read more
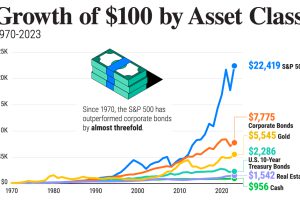
In this graphic, we show asset class returns across U.S. equities, bonds, real estate, gold and cash since 1970. Read more
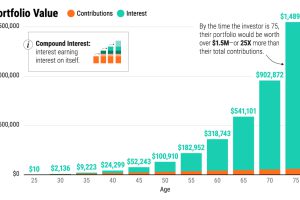
Compound interest is a powerful force in building wealth. Here’s how it impacts even the most modest portfolio over the long term. Read more

