Visualizing 25 Years of Lithium Production, by Country

Lithium production has grown exponentially over the last few decades. Which countries produce the most lithium, and how how has this mix evolved? Read more
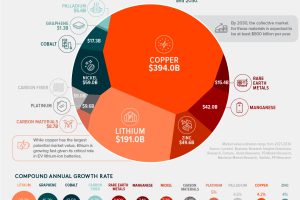
The Future Value of Disruptive Materials

Disruptive materials are key inputs in emerging, next-generation technologies. See how the forecasted market value for these materials is expected to surge by billions in the coming decade. (Sponsored content) Read more

Visualizing China’s Dominance in Battery Manufacturing (2022-2027P)

This infographic breaks down battery manufacturing capacity by country in 2022 and 2027. Read more
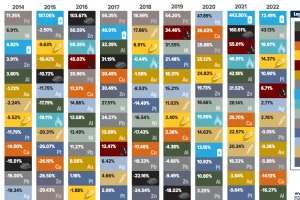
The Periodic Table of Commodity Returns (2013-2022)

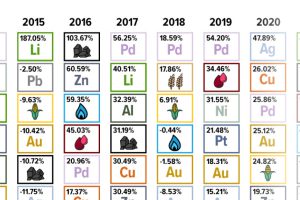
This table shows the fluctuating returns for various commodities over the past decade, from energy fuels to industrial and precious metals. Read more

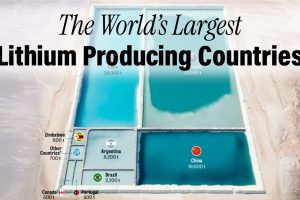
Visualizing the World’s Largest Lithium Producers

Which countries produce the most lithium, and which have the most in reserves in the ground? We look at 2022 data from the USGS. Read more

Charted: Comparing the GDP of BRICS and the G7 Countries

As BRICS is set to add six new countries, how does the bloc and its new members’ GDP compare with that of the G7? Read more
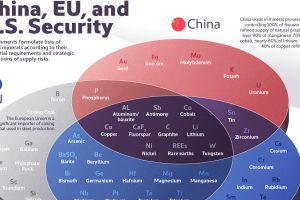
The Critical Minerals to China, EU, and U.S. National Security

Ten materials, including cobalt, lithium, graphite, and rare earths, are deemed critical by all three. Read more

The Periodic Table of Commodity Returns (2014-2023)

Commodity returns in 2023 took a hit. This graphic shows the performance of commodities like gold, oil, nickel, and corn over the last decade. Read more

Charted: Lithium-Ion Batteries Keep Getting Cheaper

Cell prices have fallen 73% since 2014. Read more