


We visualized the results of a LinkedIn study on the best U.S. companies to work for in 2024. Read more
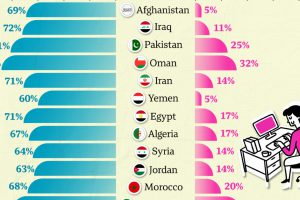
Tracking the difference between male and female labor force participation rates reveals large gender disparities for women at work. Read more
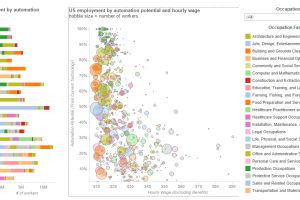
What jobs are most likely to be done by robots in the future? This interactive data visualization shows the automation potential of nearly 800 jobs. Read more
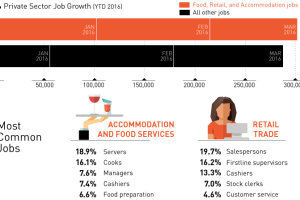
So far in 2016, a total of 589k private sector jobs have been created by the U.S. economy. However, 51% of these jobs are in two of the lowest paid… Read more

Prosthodontists and pediatric surgeons are the two featured occupations on this ranking of the least common American jobs. Read more
These graphics show how machines have destroyed jobs over time – but also how they create new ones in the process. Read more

Are you a job seeker looking to play a very ambitious long game? These are the jobs in a decade that will be the envy of the next generation of… Read more
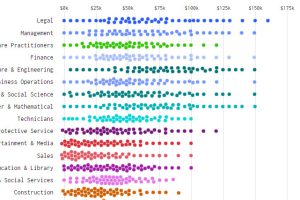
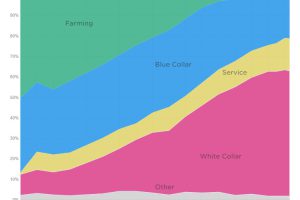
What does income distribution look like for different types of jobs – and how’s it changed over time? These charts show the drastic change from 1960 to today. Read more

The interactive graphic helps us to visualize the relationship between the supply and demand for over 1,400 technology skills. Read more
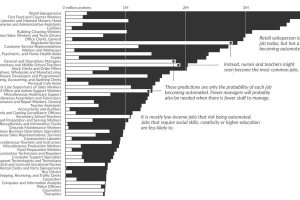
What types of jobs will be lost to automation? This data visualization applies probabilities from a well-cited study to current U.S. job numbers. Read more