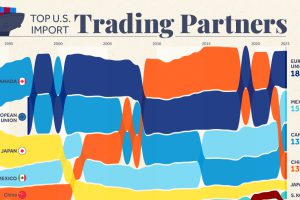
Nearly 60% of U.S. imports came from just four trade entities in 2023. We rank the top U.S. trading partners and show their growth over time. Read more
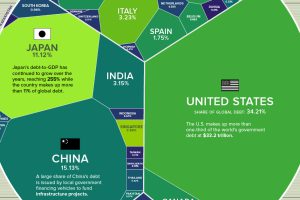
Global debt has soared since the pandemic. Which countries have the biggest stockpile of debt outstanding in 2023? Read more

We look at the share of Asian companies in the top 3,000 global firms—measured by market capitalization in 2020—broken down by industry. Read more
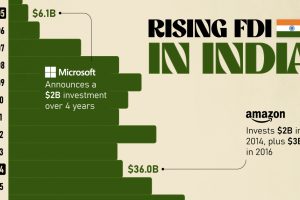
Mirroring the country’s rapid economic growth, India’s FDI (foreign direct investment) inflows have skyrocketed over the last twenty years. Read more

Major financial centers—London, Singapore, and Hong Kong—feature in these rankings of cities with the most millionaires. Read more

As top institutions advise for cautious deployment of capital next year, what assets and strategies are in their investing playbook in 2024? Read more
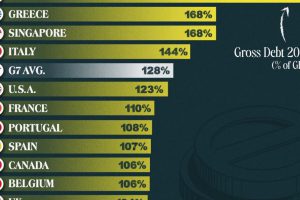
This graphic ranks government debt by country for advanced economies, using their gross debt-to-GDP ratio. Read more
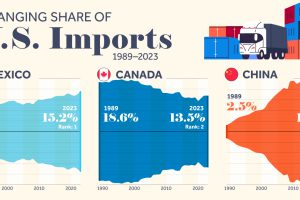
We highlight seven key U.S. trade partners and their changing share in the sources of U.S. imports from 1989–2023. Read more
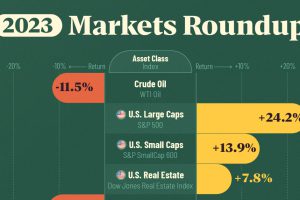
Between equities, real estate, commodities, bonds, and emerging markets, we track which major asset class ended the year on a positive note. Read more
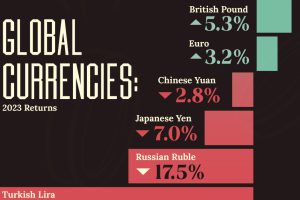
Euro, yen, and yuan—one is not like the other as we visualize the best and worst returns of the world’s major currencies. Read more

