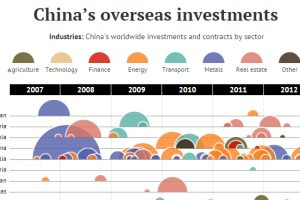
In this data visualization, every attempted Chinese overseas investment over $100 million is organized by country and sector. Read more
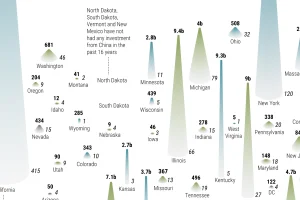
China has invested over $1 trillion overseas in the last decade, with the U.S. being the top destination. See the states and industries that cashed in. Read more
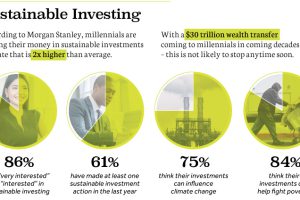
Money put towards ’causes’ has increased 33% in just two years to $8.7 trillion. See why sustainable investing has gone mainstream in today’s chart. Read more
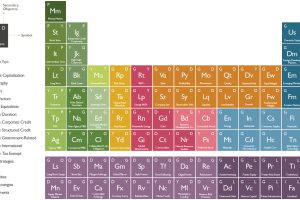
The investment universe is vast – but it’s also made up of many smaller components. See it all depicted in this nifty periodic table of investments. Read more
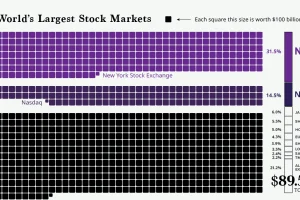
The world’s stock market exchanges have a combined market cap of $89.5 trillion, with American exchanges making up all most half that value. Read more
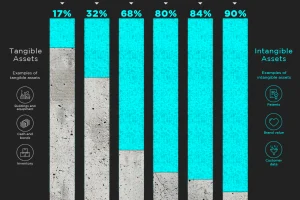
Intangible assets have increased as a portion of total assets in the S&P 500 for 45 years. Today they represent 90% of all assets. Read more
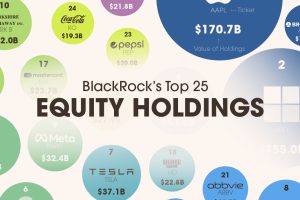
BlackRock is the world’s largest asset manager, with over $9 trillion in holdings. Here are the company’s top equity holdings. Read more

