

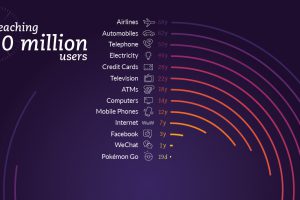
It used to take decades to accumulate 50 million users for a new product, but now it can be done in just days thanks to the power of network effects. Read more
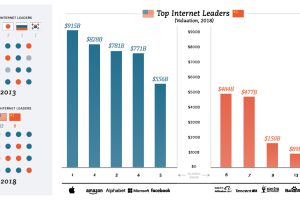
A total of 12 of the largest tech giants come from the United States, while eight hail from China. All other countries combine for zero. Read more
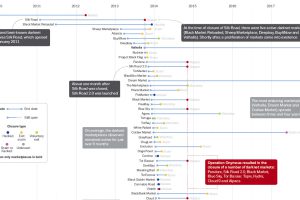
How often does a dark web marketplace last, on average? This data visualization offers a data-driven look at the survival rate of underground marketplaces. Read more

This in-depth infographic provides a practical guide on how anyone can increase privacy on their browser, social media networks, and mobile device. Read more
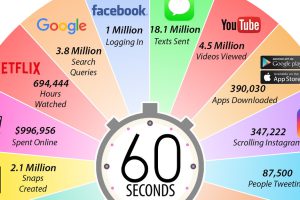
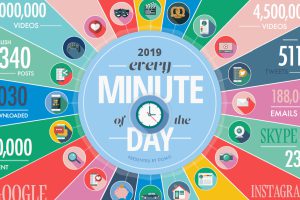
In every internet minute, there is an extraordinary amount of activity. Wrap your head around it all with this nifty infographic. Read more
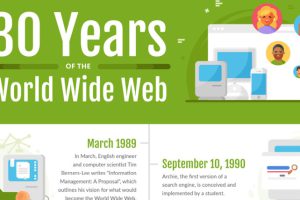
This month marked the 30th birthday of the World Wide Web. Here are the events that shaped it over the course of its history. Read more
Visualizing the vast amount of data produced every single minute, and why it’s still early days in the big data era of technology. Read more
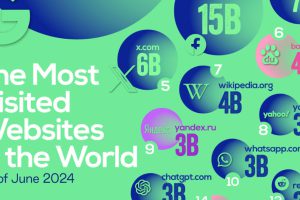
This visualization ranks the most visited websites worldwide as of June 2024, based on data from SimilarWeb. Read more
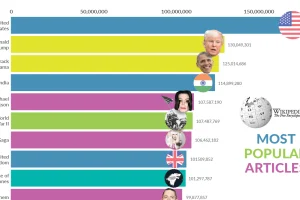
Millions flock to Wikipedia every day to satisfy their curiosity on every imaginable topic. What have been the most popular Wikipedia pages over time? Read more
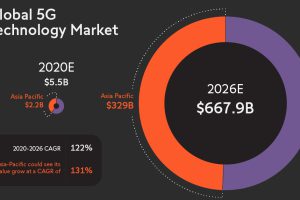
With the imminent 5G revolution, total connectivity could be at our fingertips. This graphic looks at its far-reaching IoT applications and potential. Read more