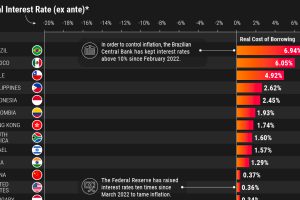
What countries have the highest real interest rates? We look at 40 economies to analyze nominal and real rates after projected inflation. Read more
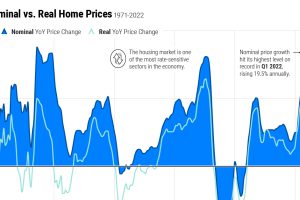
Home price growth has moderated amid rising interest rates and a narrow housing supply. Here’s how prices compare to historical trends. Read more
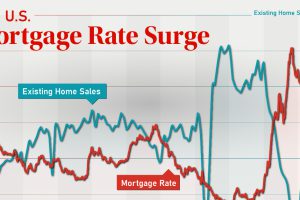
In this graphic, we take a look at the recent U.S. mortgage rate surge, and how the 30-year fixed-rate mortgage has evolved since 2013. Read more
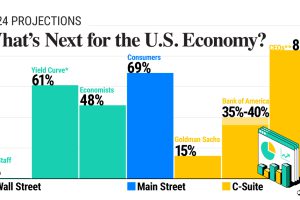
In this graphic, we show the probability of a U.S. recession in 2024, based on forecasts from Wall Street, Main Street, and the C-Suite. Read more
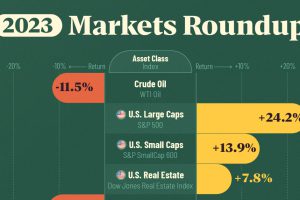
Between equities, real estate, commodities, bonds, and emerging markets, we track which major asset class ended the year on a positive note. Read more
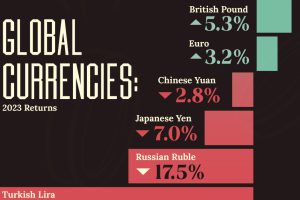
Euro, yen, and yuan—one is not like the other as we visualize the best and worst returns of the world’s major currencies. Read more
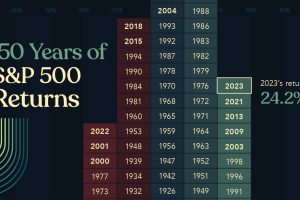
Last year, U.S. stocks took investors by surprise. This graphic shows S&P 500 historical returns since 1875 to put 2023 returns into context. Read more
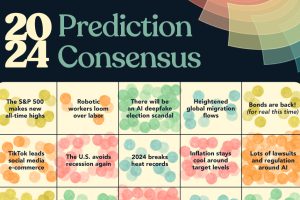
Using our database of 700+ forecasts from reports, articles, interviews, and more, we highlight what experts think will happen in 2024. Read more


