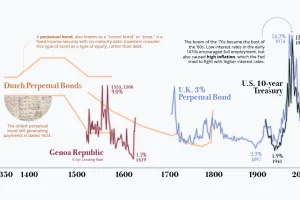
Interest rates sit near generational lows — is this the new normal, or has it been the trend all along? We show a history of interest rates in this graphic. Read more
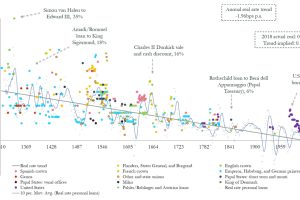
Could interest rates enter negative territory permanently? This chart plots trend data over 700 years, showing that it could be a possibility. Read more
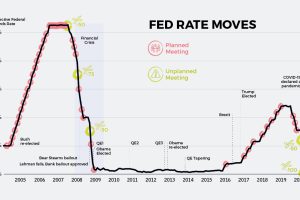
As interest rates continue their historic spiral downwards, the world’s central banks are running out of conventional tools to settle markets. Read more
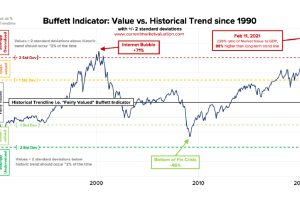
At 228%, the Buffett Indicator has reached all-time highs, which means America’s stock market value is currently more than double the country’s GDP. Read more
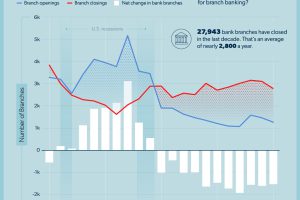
Over the last decade, U.S. bank locations have closed down at an alarming rate. Are we nearing the end of branch banking? Read more
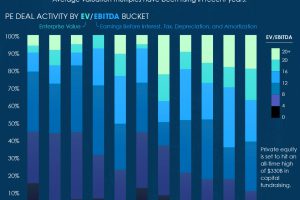
The last decade has witnessed an avalanche of investor capital gravitating towards private equity, along with much richer deal valuations. Read more
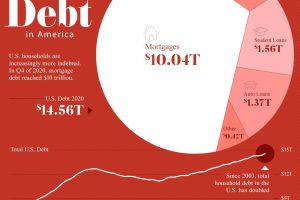
Since 2003, U.S. household debt has doubled to over $14.5 trillion. We break down the components of this colossal figure. Read more

Global debt reached $226T by the end of 2020 – the biggest one-year jump since WWII. This graphic compares the debt-to-GDP ratio of various countries. Read more

The global pool of ultra-high-net-worth individuals (UHNWI) has skyrocketed 75% in five years. In 2021 alone, it jumped 9.3%. Read more
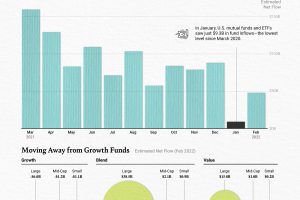
With the Ukraine crisis unfolding and rising interest rates on the horizon, investors are moving out of U.S. equity funds. Read more

