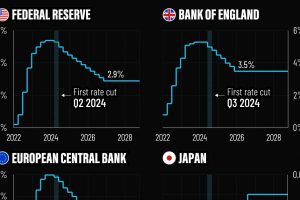
In this graphic, we show the IMF’s interest rate forecast for the U.S., Europe, the UK, and Japan for the next five years ahead. Read more
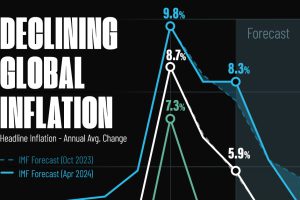
Here are IMF forecasts for global inflation rates up to 2026, highlighting a slow descent of price pressures amid resilient global growth. Read more

From the heydays of the Dotcom boom, the number of tech IPOs has dropped steeply over the years. But 2021 saw a brief resurgence. Read more

As U.S. home values continue to climb, we show the growth in house prices by state in 2024 at a time of persistently high interest rates. Read more

As the cost of home ownership nears record levels, we show the household income required to buy a median-priced home in 50 U.S. metro areas. Read more

Why do the exchange rates between currencies fluctuate? This infographic looks at six major factors that drive these movements. Read more

The U.S. national debt is climbing at a rapid pace, increasing by $1 trillion since the start of the year alone. Read more
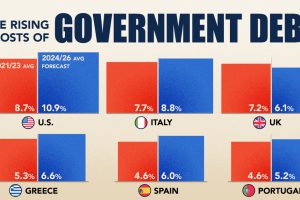
The cost of servicing the national debt is surging as high interest rates push up borrowing costs amid a rapidly growing debt pile. Read more
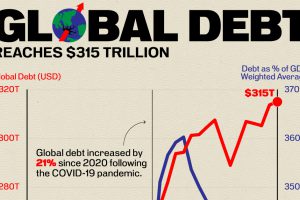
Global debt has soared to a new landmark, adding $1.3 trillion in debt in the first quarter of 2024 alone. Read more


