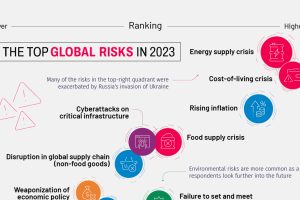
This year’s Global Risks Report highlights ongoing economic issues, such as inflation, as well as existential threats like biological weapons Read more

From New York to Damascus, this infographic uses EIU cost of living data to rank the world’s most and least expensive cities to live in Read more
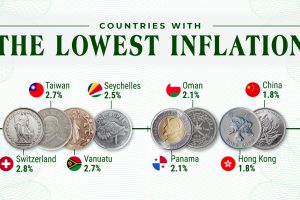
Just four economies around the world had inflation below 2% in 2022. We show the countries with the lowest inflation globally. Read more
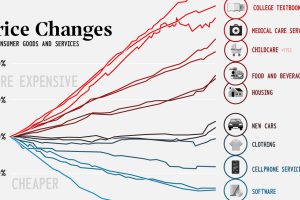
This century has seen divergent price movement. Many consumer goods are cheaper, while critical categories like health and education have skyrocketed. Read more
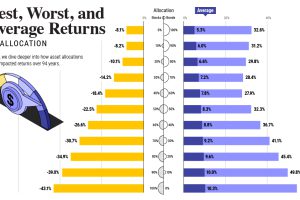
How have investment returns for different portfolio allocations of stocks and bonds compared over the last 90 years? Read more
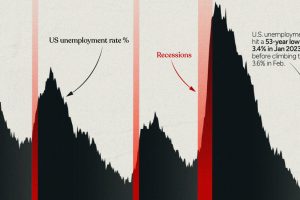
This infographic examines 50 years of data to highlight a clear visual trend: recessions are preceded by a cyclical low in unemployment. Read more
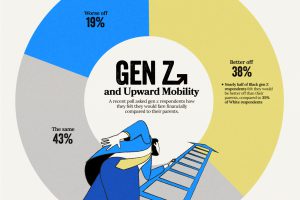
Despite the looming uncertainty, members of Gen Z maintains an optimistic outlook about their financial future Read more
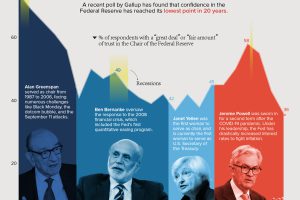
Public trust in the Federal Reserve chair has hit its lowest point in 20 years. Get the details in this infographic. Read more
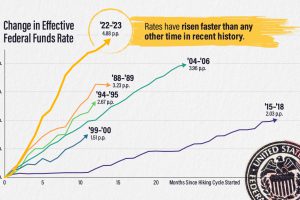
The effective federal funds rate has risen nearly five percentage points in 14 months, the fastest interest rate hikes in modern history. Read more


