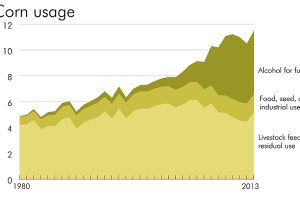
Lend an ear, because the shifting market for corn in the United States means big things for commodity investors. Read more
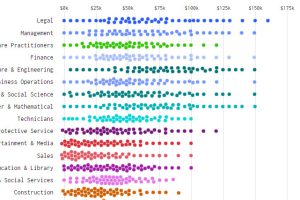
What does income distribution look like for different types of jobs – and how’s it changed over time? These charts show the drastic change from 1960 to today. Read more
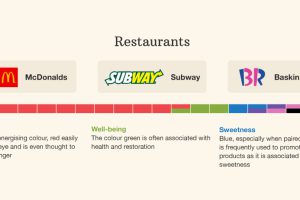
This infographic breaks down the colors used in branding across industries – and it shows how different colors can mean different things based on context. Read more
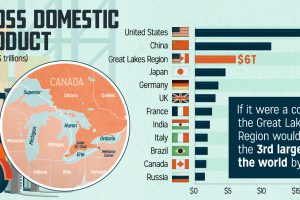
We don’t think of the Great Lakes as its own economy, but maybe we should. It’s tightly integrated by trade, and generates $6 trillion in GDP each year. Read more
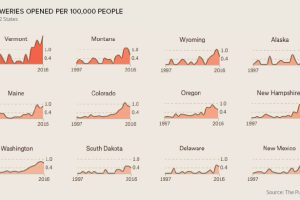
The craft beer boom is a nation-wide trend, but certain cities have an outsize influence on the industry – and beer lovers. Read more
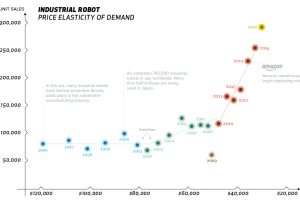
In a textbook example of Wright’s Law, the unit cost of each industrial robot is dropping as more robots are being made. Read more
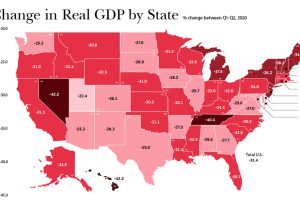
In just a few months, the U.S. economy reeled from COVID-19. As real change in GDP suffered, which states and industries were the hardest-hit? Read more
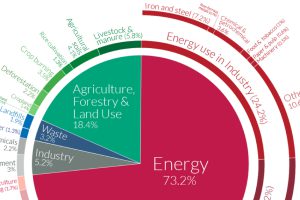
World emissions have reached almost 50 billion tonnes of greenhouse gases (GHGs) and counting. Which major sectors do they originate from? Read more
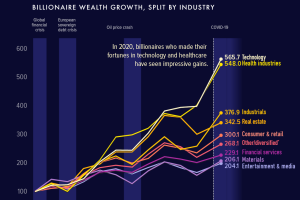
After the coronavirus-related market crash in early 2020, billionaires across every sector saw a double-digit increase in wealth. Read more


