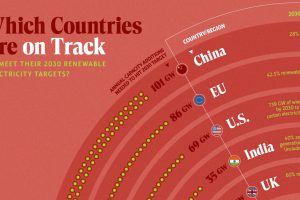
In this graphic, we visualize whether major electricity-consuming countries are on track to meet their 2030 renewable energy targets. Read more
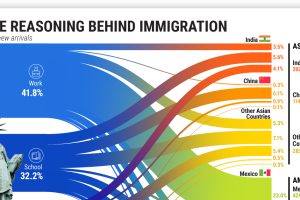
More than 45 million American residents were immigrants in 2021, having moved for various reasons. Read more
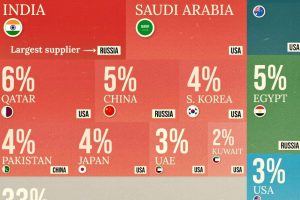
Which countries imported weapons to boost their defenses in 2022? We rank the biggest by their the share of global arms imports. Read more

We look at the share of Asian companies in the top 3,000 global firms—measured by market capitalization in 2020—broken down by industry. Read more
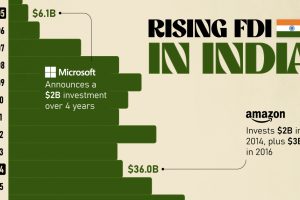
Mirroring the country’s rapid economic growth, India’s FDI (foreign direct investment) inflows have skyrocketed over the last twenty years. Read more

As top institutions advise for cautious deployment of capital next year, what assets and strategies are in their investing playbook in 2024? Read more
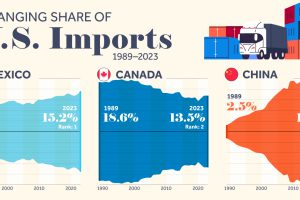
We highlight seven key U.S. trade partners and their changing share in the sources of U.S. imports from 1989–2023. Read more
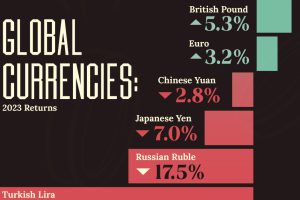
Euro, yen, and yuan—one is not like the other as we visualize the best and worst returns of the world’s major currencies. Read more
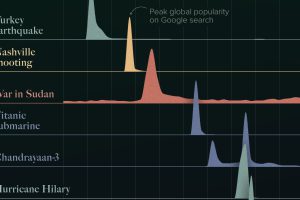
The top 10 news stories of 2023 according to Google Search trends, including two wars, three hurricanes, and a new moon landing. Read more

What are India’s top companies? This graphic showcases the country’s largest 50 publicly traded companies by market capitalization. Read more

