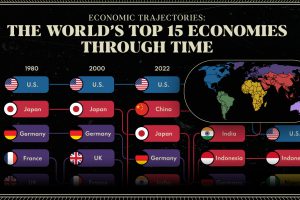
We provide a historical and predictive overview of the top economies in the world, including projections all the way to 2075. Read more
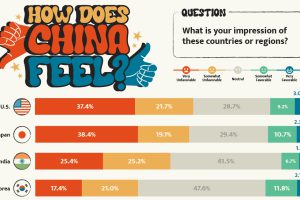
What is the Chinese public’s view of world powers? This visual breaks down Chinese sentiment towards other countries. Read more
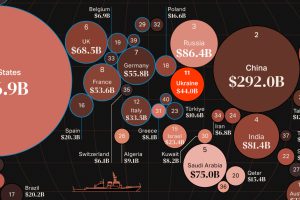
War in Europe has caused Ukraine’s military spend to jump up by 640%. How do the world’s largest military budgets compare? Read more
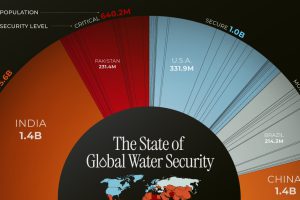
This chart highlights the different countries, and the number of people, facing water security issues around the world. Read more
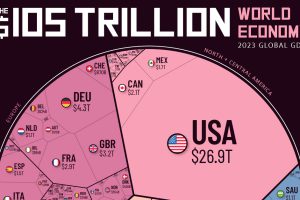
How much does each country contribute to the $105 trillion world economy in 2023, and what nations are seeing their nominal GDPs shrink? Read more

The majority of billion-dollar startups in the U.S. have at least one immigrant founder. Here is where those founders are from. Read more
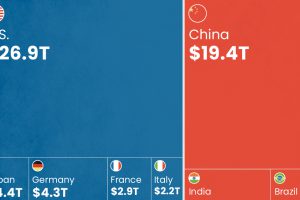
As BRICS is set to add six new countries, how does the bloc and its new members’ GDP compare with that of the G7? Read more

The global middle class is expected to grow by 113 million people in 2024. We visualize this growth by country and region. Read more
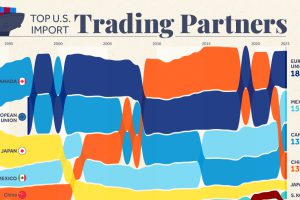
Nearly 60% of U.S. imports came from just four trade entities in 2023. We rank the top U.S. trading partners and show their growth over time. Read more
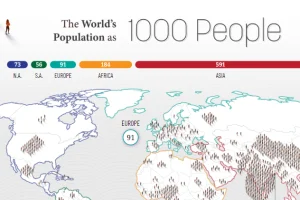
How would all the people in the world be spread out if there were only 1,000 people on Earth? This interactive map examines the breakdown. Read more

