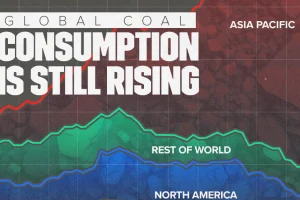
China remains the largest coal consumer, making up 56% of the global total. Read more
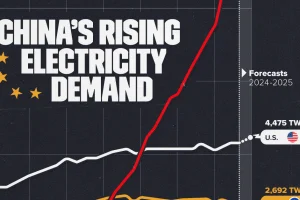
After rapid industrialization in the 1990s, mass urbanization is driving demand even higher. Read more
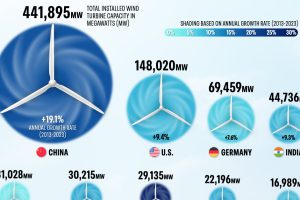
Global wind power capacity hit fresh records in 2023 thanks to strategic government investment and lower technology costs. Read more
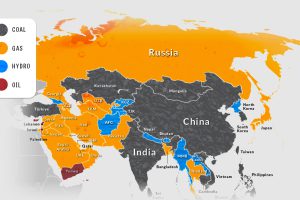
Asia is on its way to account for half of the world’s electricity generation by 2025. How is this growing demand currently being met? Read more
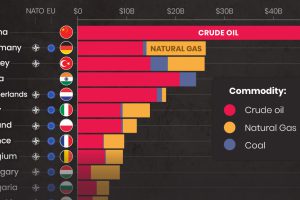
While Russia still makes billions from fossil fuel exports, revenues are declining. Here are the largest importers since the start of the invasion. Read more

In this graphic we explore the world’s declining fertility rate over the last 60 years and the disparity in fertility rates between nations Read more
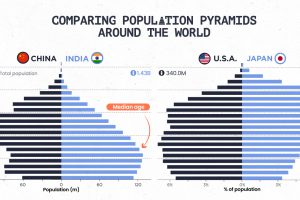
Population pyramids can show a country’s demographic advantages and challenges at a glance. See how different parts of the world stack up. Read more
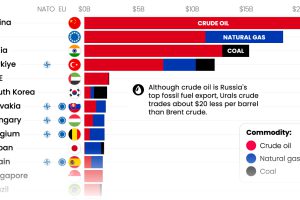
With Russia’s revenues from fossil fuel exports having declined significantly, which countries are still importing Russian fossil fuels? Read more

This graphic shows the 15 richest families in Asia. From energy to banking, these dynasties have built fortunes across many sectors. Read more


