

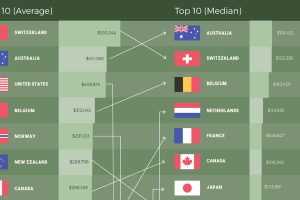
How do the rankings of the world’s most affluent countries change when using different metrics to measure wealth per capita? Read more
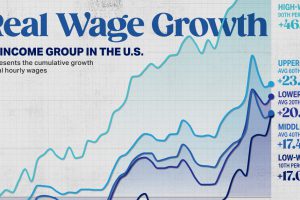
Since 2019, low-paid workers’ real income spiked more than the last 40 years combined. Here are real wages over time, by income group. Read more
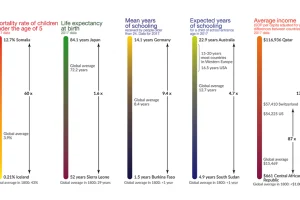
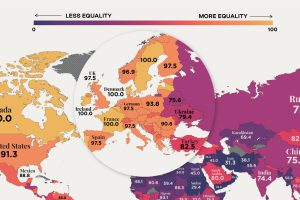
This visualization shows the global inequality gap — a difference in the standards of living around the world, as well as how it’s changed over 200 years. Read more
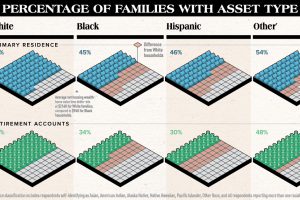
White families are more likely to hold assets of any type compared to other races. This chart highlights the substantial racial wealth gap. Read more
In recent years, many economies have made women’s rights a priority, yet only 10 countries in the world offer full legal protections to women. Read more
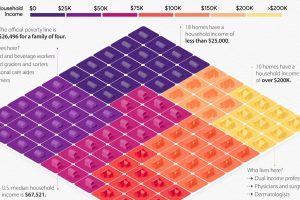
This visual breaks down U.S. household income categories as 100 homes, based on the most recent data from the U.S. Census Bureau. Read more
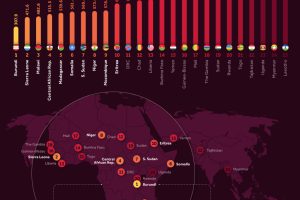
Analyzing 2023 per capita GDP numbers from the International Monetary Fund lets us know where the poorest countries are. Read more
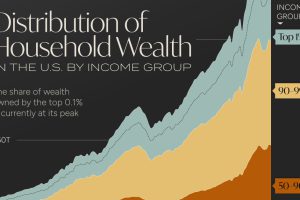
Wealth distribution in America is becoming increasingly unequal, with the wealth held by the top 0.1% reaching its highest level on record. Read more