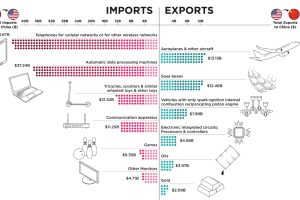
This infographic ranks the top 10 exports and imports of the U.S. and China, the two most significant global economic superpowers today. Read more
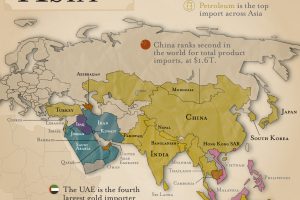
What are the top imports across Asia? Petroleum is the most popular import, followed by vehicles and electronic integrated circuits. Read more

What are the most popular imports across the Americas? Petroleum is number one, followed by vehicles and ships. Read more

The UK and the EU have recently laid out new terms for their relationship. So how important is the UK’s trade with the EU? Read more

The world’s biggest pharmaceutical companies are worth $4.1 trillion. Here we map the top 100 companies based on their market cap value. Read more

This graphic visualizes Ukraine’s top international trading partners and the country’s most exported and imported products in 2020. Read more

The EU’s energy dependency has become a major issue amid Russia’s invasion of Ukraine. See what the data says in this infographic. Read more
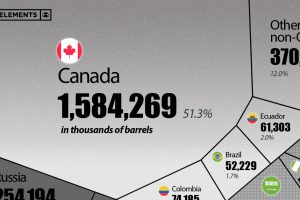
This visualization breaks down U.S. oil imports by country for 2021, showing the split by OPEC and non-OPEC nations. Read more
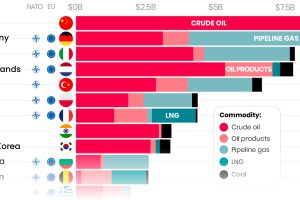
Here are the top importers of Russian fossil fuels since the start of the war. Read more

U.S. trade of goods amounted to nearly $4.6 trillion in 2021, and Canada, Mexico, and China were the country’s biggest trading partners. Read more

