

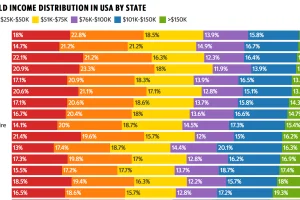
This colorful data visualization breaks down the household income of each U.S. state into six income brackets. Read more
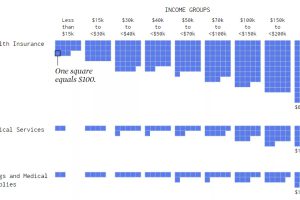
Visualizing how different income groups spend their money on things like housing, food, transportation, health, and travel. Read more
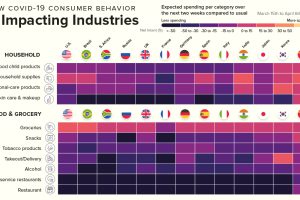
This infographic showcases the industries that will benefit from COVID-19 consumer spending, and the industries that have a very uncertain future. Read more