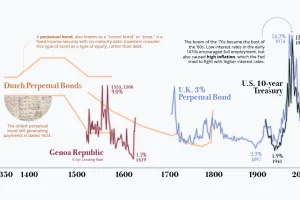
Interest rates sit near generational lows — is this the new normal, or has it been the trend all along? We show a history of interest rates in this graphic. Read more

The history of pandemics, from the Antonine Plague to the novel coronavirus (COVID-19) event, ranked by their impact on human life. Read more
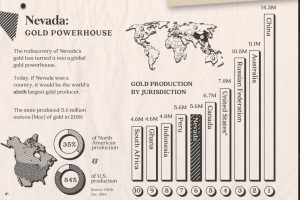
Nevada accounts for 84% of U.S. gold production today. Here’s a look at the state’s rich history, its prolific production, and what the future may hold. Read more

This video highlights the history of American counties, and how their boundaries have changed over the last 300 years. Read more

This graphic looks at how long vaccine development has historically taken for pandemics dating back to the 1900s. Read more
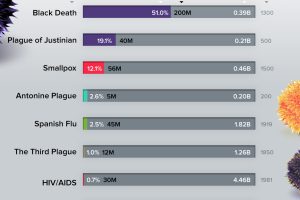
During its heyday, the Black Death wiped out roughly 50% of the world’s population—making it one of the deadliest pandemics to date. Read more

What did Europe look like in the Middle Ages? This map is a snapshot of medieval Europe back in 1444, during the rise of the Ottoman Empire. Read more

We examine an ambitious timeline that details the power of various civilizations going all the way back to 2,000 B.C. Read more
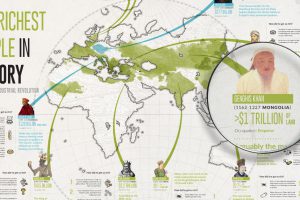
What do Augustus Caesar, Cosimo de Medici, Mansa Musa, and Genghis Khan have in common? They were some of the richest people in all of history. Read more
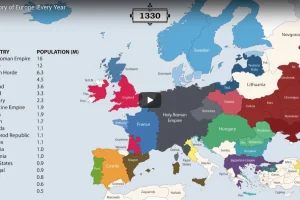
The history of Europe is breathtakingly complex, but this animation helps makes sense of 2,400 years of change on the European map. Read more

