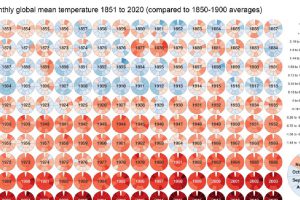
Global Temperature Graph (1851-2020) View the high-resolution of the infographic by clicking here. Since 1880, the Earth’s average surface temperature has risen by 0.07°C (0.13°F) every decade. That number alone… Read more

Over the last three decades, the growth of tech companies has driven a shift in the ranking of the most valuable companies in the U.S. Read more

