

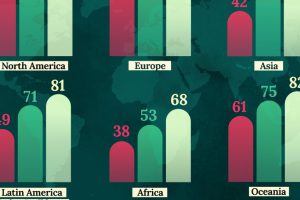
This map shows life expectancy at birth for key global regions, from 1950 to 2050F. Read more
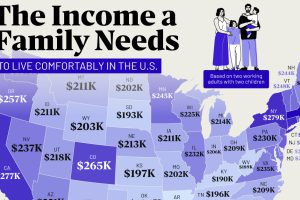
Families in expensive states require over $270,000 annually to live comfortably. Read more
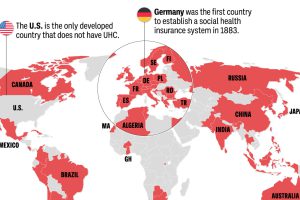
Most of the world population has universal health coverage (UHC). This map shows which countries do and don’t provide public health coverage. Read more

How cloud computing and other technology is changing healthcare. Learn in this infographic what changes in healthcare in the cloud. Read more
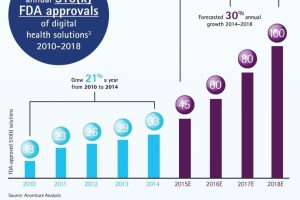
The confluence of two important trends in healthcare are about to disrupt the digital health landscape, creating savings of $50B by 2018. Read more
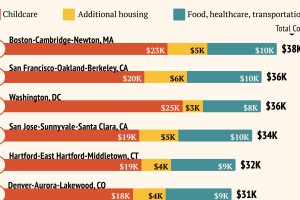
Raising a child in a large U.S. metro costs an average of $25k per year. Read more

Prosthodontists and pediatric surgeons are the two featured occupations on this ranking of the least common American jobs. Read more
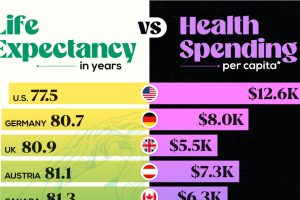
America’s per capita health spend is now past $12,500, but for what gains? A quick comparison with its peers. Read more
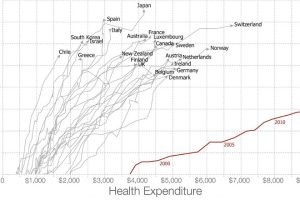
Americans spent more than $3 trillion, or 17.5% of GDP, on healthcare in 2015. Are they getting any bang for their buck? Read more
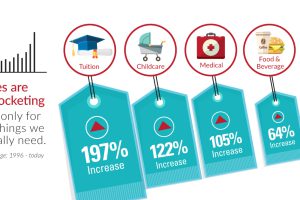
Over the last 20 years, the things that are the most important to us, such as healthcare, education, food, and shelter, have skyrocketing prices. Read more