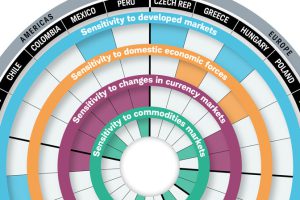
While they all have high expectations for economic growth, the risks facing emerging markets are very different. This visualization breaks it all down. Read more
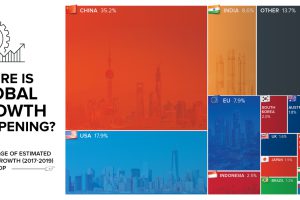
By 2019, the global economy is projected to expand another $6.5 trillion. Today’s chart shows which countries will help to fuel this global growth. Read more
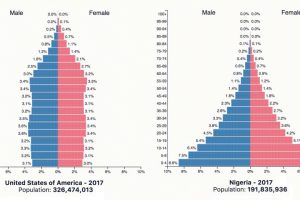
The world’s 10 most populous countries may all have many millions of people, but their future growth prospects are very different. Read more
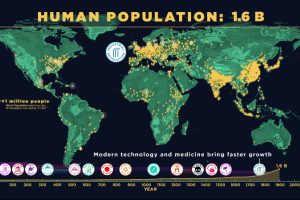
This animation captures 200,000 years of human population growth – see everything from the invention of farming to the impact of the Black Death. Read more
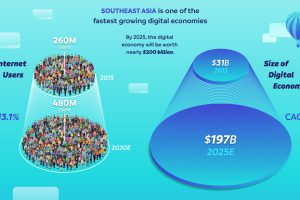
Tech is driving growth in Southeast Asia, and the region will soon boast a $200 billion digital economy in just a few years. Read more
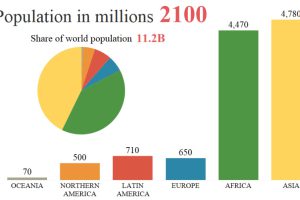
By 2100, the global population is projected to rise from 7.6 billion to 11.2 billion people. This animation shows how that growth will occur by region. Read more
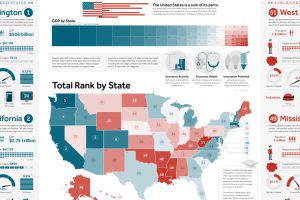
This giant infographic has state economies ranked from best to worst, based on an overall score comprised of 27 different metrics. Read more

With every country’s growth visualized on a logarithmic scale, we look at a few world population growth outliers and their unique stories. Read more
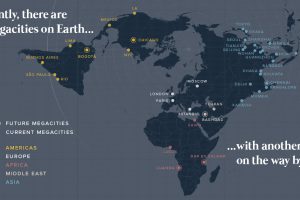
There are currently 33 megacities in the world with over 10 million inhabitants – but by 2030, there will be six new megacities, including one in the U.S. Read more
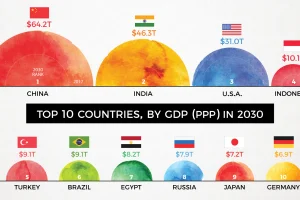
By 2030, the complexion of the global economy could look very different. This animation shows how the world’s biggest economies will change over time. Read more

