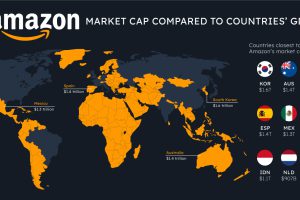
How do the big tech giants compare to entire countries? Here’s how Apple, Microsoft, and Amazon’s market caps stack up against national GDP. Read more

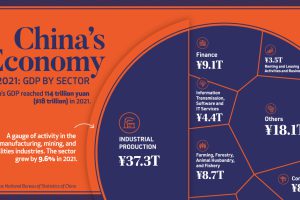
China’s economy reached a GDP of 114 trillion yuan ($18 trillion) in 2021, well above government targets. What sectors drove that growth? Read more

How much does each country contribute to the $105 trillion world economy in 2023, and what nations are seeing their nominal GDPs shrink? Read more

Services-producing industries account for the majority of U.S. GDP in 2023, followed by other private industries and the government. Read more

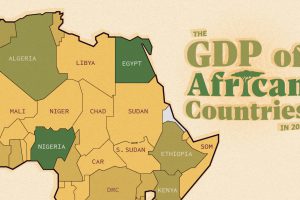
The top three economic powerhouses of Africa contribute more than one-third to the African economy. We rank the nations of the world’s second-largest continent by 2024 GDP estimates. Read more

