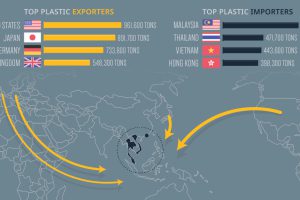
Every year, the United States exports almost one million tons of plastic waste, including ‘recycled’ materials. Where does all of this waste go? Read more
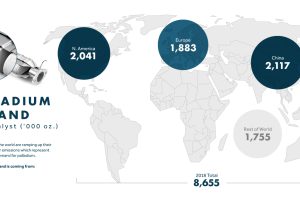
The world is in critical need of palladium. It’s a crucial metal in reducing emissions from gas-powered vehicles, and our secret weapon for cleaner air. Read more
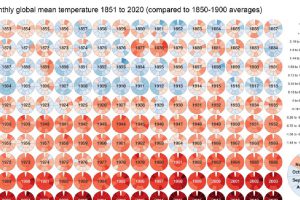
Global Temperature Graph (1851-2020) View the high-resolution of the infographic by clicking here. Since 1880, the Earth’s average surface temperature has risen by 0.07°C (0.13°F) every decade. That number alone… Read more

New research around ESG investing highlights that there are three common motivators for investors to invest in ESG assets. Read more
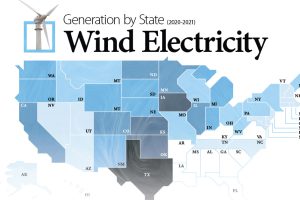
Wind energy is the largest source of renewable electricity in North America. This graphic maps U.S. states by wind electricity generation. Read more
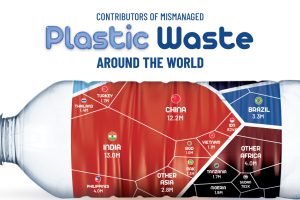
About 22% of the world’s annual plastic waste generation is mismanaged. Here’s a break down of mismanaged plastic waste by country. Read more
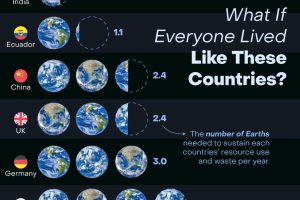
How many Earths would we need if the global population lived like Americans? This infographic answers this question and more. Read more
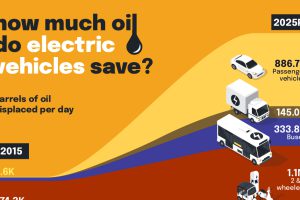
How much oil is saved by adding electric vehicles into the mix? We look at data from 2015 to 2025P for different types of EVs. Read more
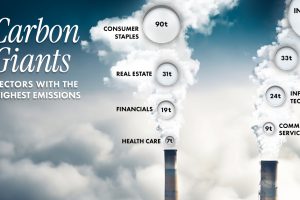
Comparing average Scope 1 emission intensities by sector according to an analysis done by S&P Global Inc. Read more
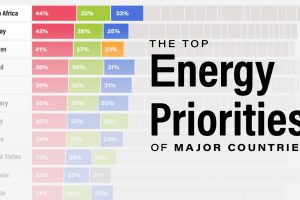
This infographic lists the top energy priorities in 28 countries, based on an Ipsos survey involving 24,000 people. Read more

