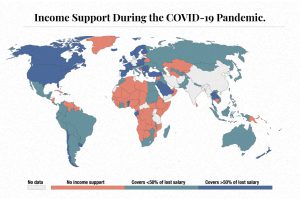
The need for income support during COVID-19 has been vast. This map visualizes different levels of income support around the world. Read more

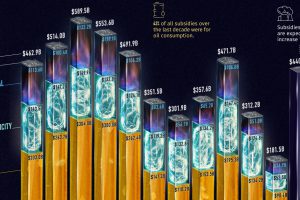
Governments pour nearly $500 billion into fossil fuel subsidies annually. This chart breaks down fossil fuel subsidies between 2010 and 2021. Read more

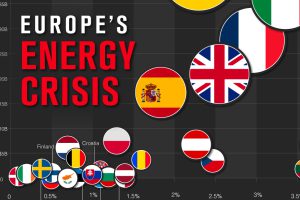
As European gas prices soar, countries are introducing policies to try and curb the energy crisis. Read more

Services-producing industries account for the majority of U.S. GDP in 2023, followed by other private industries and the government. Read more


