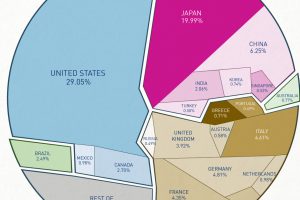
This data visualization shows total world debt by country and debt-to-GDP ratio. Read more
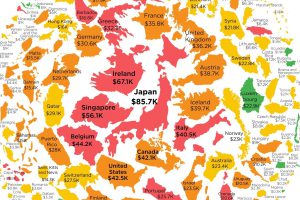
Want to know how much money the government has borrowed on your behalf? This infographic shows government debt per capita for every country in the world. Read more
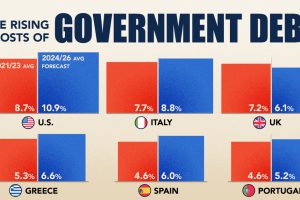
The cost of servicing the national debt is surging as high interest rates push up borrowing costs amid a rapidly growing debt pile. Read more
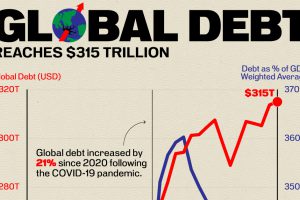
Global debt has soared to a new landmark, adding $1.3 trillion in debt in the first quarter of 2024 alone. Read more

After an unprecedented borrowing spree in response to COVID-19, what does government debt look like around the world? Read more
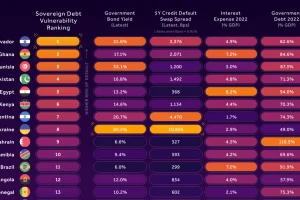
In this infographic, we examine new data that ranks the top 25 countries by their default risk. Read more
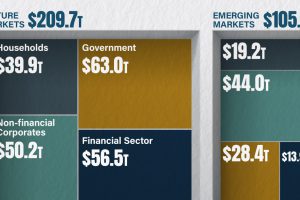
The world hit a new record of $315 trillion in global debt in Q1 2024. Which markets and sectors are leading this surge in debt? Read more
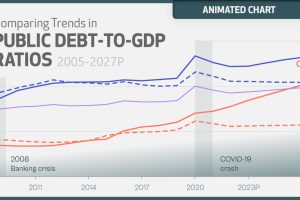
The surge in global debt poses significant risks to government balance sheets. Here’s where it’s projected to reach over the next five years. Read more
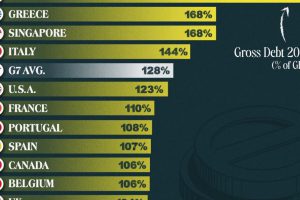
This graphic ranks government debt by country for advanced economies, using their gross debt-to-GDP ratio. Read more

Listing the many programs—health, defense, veterans benefits—that U.S. federal taxes fund, in the form of a single federal tax dollar. Read more

