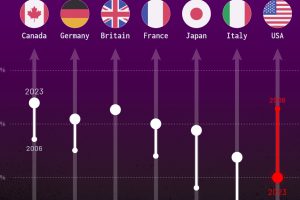
How much do you trust the government and its various institutions? We look at data for G7 countries for the time period of 2006-2023. Read more
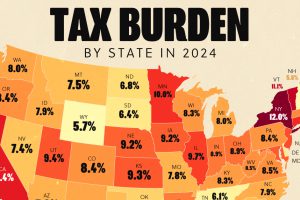
Tax burden measures the percent of an individual’s income that is paid towards taxes. See where it’s the highest by state in this graphic. Read more
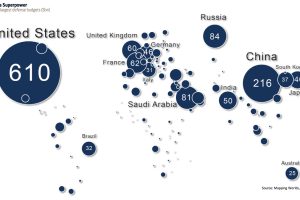
This map shows global defense spending by country – and it puts U.S. military spending into perspective. Read more
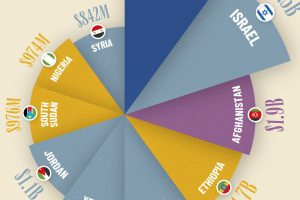
See which countries received the most U.S. foreign aid in fiscal year 2022, based on the latest official numbers. Read more

Singapore Prime Minister Lawrence Wong is the highest-paid government leader. Read more
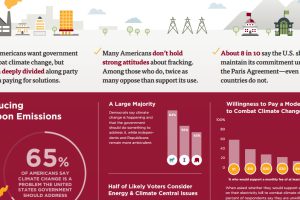
This survey of over 1,000 Americans tells you what people actually believe about fracking, coal, climate change, and other hot button energy issues in the U.S. Read more

Even though hackers get all the publicity and media attention, the greatest cybersecurity threat may actually come from inside an organization. Read more
The American Society of Civil Engineers says that if the growing infrastructure gap is not closed, it will create a $4 trillion drag on U.S. GDP by 2025 Read more


