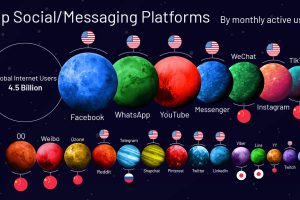
Visualizing the Social Media Universe in 2020

Nearly half the world has tapped into the social media universe. Monthly Active Users (MAUs) quantifies the success of these giant platforms. Read more
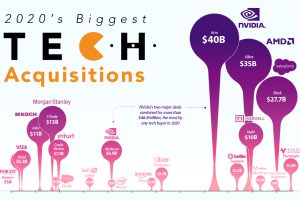
Visualizing the Biggest Tech Mergers and Acquisitions of 2020

In a challenging year for most, many large tech companies have prospered and grown. We visualize the year’s biggest tech mergers and acquisitions. Read more
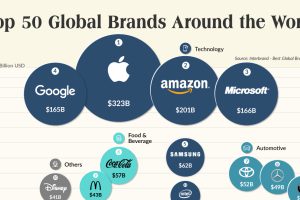
The Top 50 Most Valuable Global Brands

This graphic showcases 2020’s top 50 most valuable global brands and explores how COVID-19 has triggered a brand shift with huge implications. Read more
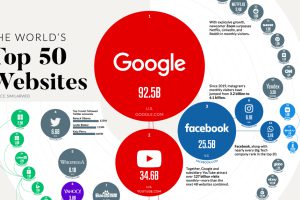
The 50 Most Visited Websites in the World

Just three websites get 152 billion visits monthly, outpacing the rest of the internet. Here, we rank the most visited websites worldwide. Read more
The World’s Most Searched Consumer Brands

From Apple to Zara, this unique map showcases which popular consumer brands were searched for the most around the world. Read more

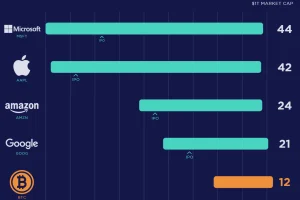
Bitcoin is the Fastest Asset to Reach a $1 Trillion Market Cap

Bitcoin is now part of a select very few assets that hold a market cap greater than $1 trillion. How long did it take to get there? Read more
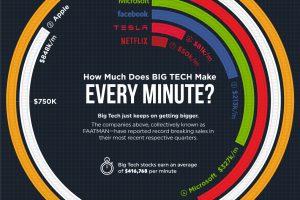
How Much Does Big Tech Make Every Minute?

Big Tech just keeps on getting bigger. How much do the FAATMAN companies generate in revenues per minute? Read more

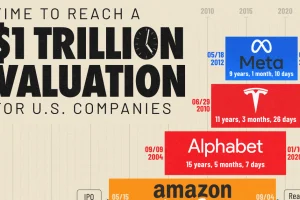
Berkshire Joins the $1 Trillion Club: How Long Did It Take?

See how it long it took America’s most valuable companies, including Berkshire Hathaway, to reach a $1 trillion valuation in this graphic. Read more

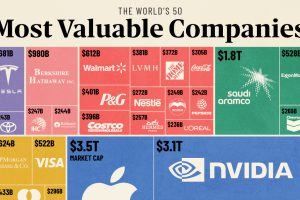
Ranked: The 50 Most Valuable Companies in the World in 2024

See a breakdown of the world’s 50 most valuable companies, which represent $34 trillion in combined market capitalization. Read more

The Data Behind America’s H-1B Visa Program

This infographic covers all the key charts and data for the H1-B visa, which grants foreign skilled workers employment in the U.S. Read more