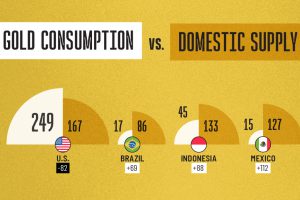
Visualizing Gold Consumption vs. Domestic Supply

India’s consumption is 50 times higher than its domestic supply. Read more

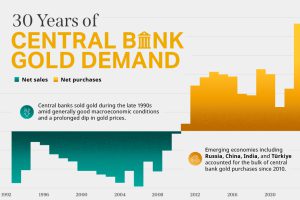
Charted: 30 Years of Central Bank Gold Demand

Globally, central banks bought a record 1,136 tonnes of gold in 2022. How has central bank gold demand changed over the last three decades? Read more

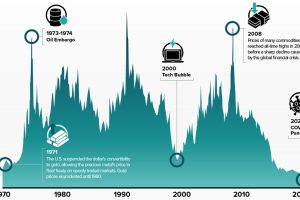
Charted: Commodities vs Equity Valuations (1970–2023)

The commodities-to-equities ratio recently hit a 50-year low. In the past, when this ratio reached such levels, commodity supercycles began. Read more

Charted: What are Retail Investors Interested in Buying in 2023?

What key themes and strategies are retail investors looking at for the rest of 2023? Preview: AI is a popular choice. Read more
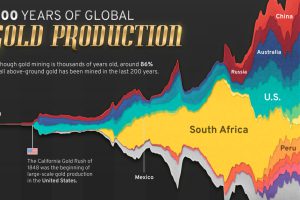
200 Years of Global Gold Production, by Country

Global gold production has grown exponentially since the 1800s, with 86% of all above-ground gold mined in the last 200 years. Read more

All the Metals We Mined in One Visualization

This infographic visualizes the 2.8 billion tonnes of metals mined in 2022. Read more

The Critical Minerals to China, EU, and U.S. National Security

Ten materials, including cobalt, lithium, graphite, and rare earths, are deemed critical by all three. Read more

Ranked: Which Asset Class Logged the Biggest Return in 2023?

Between equities, real estate, commodities, bonds, and emerging markets, we track which major asset class ended the year on a positive note. Read more
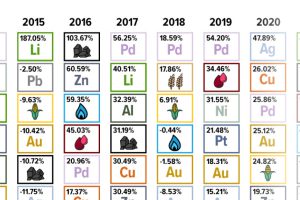
The Periodic Table of Commodity Returns (2014-2023)

Commodity returns in 2023 took a hit. This graphic shows the performance of commodities like gold, oil, nickel, and corn over the last decade. Read more

Charted: The Value Gap Between the Gold Price and Gold Miners

While the price of gold has reached new record highs in 2024, gold mining stocks are still far from their 2011 peaks. Read more