

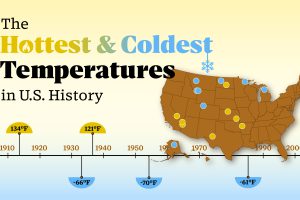
The highest temperature was registered in Death Valley, California, in 1913. Read more
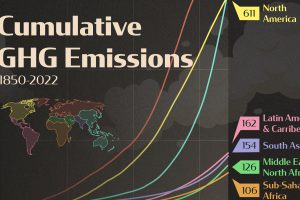
Just three regions have contributed 79% of global cumulative GHG emissions since 1850. See where they are in this graphic. Read more
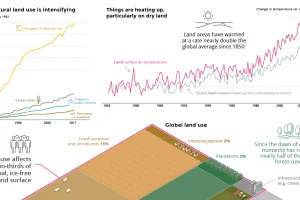
We highlight the five most important takeaways from the IPCC’s recent 1,400+ page report on climate change and land use. Read more
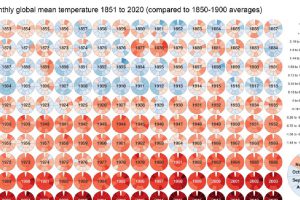
Global Temperature Graph (1851-2020) View the high-resolution of the infographic by clicking here. Since 1880, the Earth’s average surface temperature has risen by 0.07°C (0.13°F) every decade. That number alone… Read more
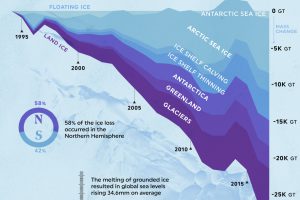
In just over two decades, the planet has seen 28 trillion tonnes in global ice loss. 58% of this ice loss occurred in the Northern Hemisphere. Read more
What’s the lowest-carbon way to travel? Here’s how much CO2 different types of vehicles emit per passenger-kilometer. Read more

More carbon in the atmosphere is creating a hotter world—and gradually fueling both climate change and instances of wildfires. Read more
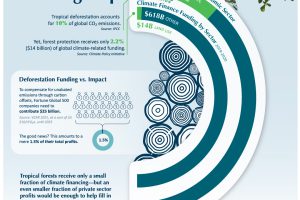
Deforestation accounts for 10% of global CO2 emissions, yet receives just a small slice of climate funding. See why closing this funding gap is necessary to combat climate change. (Sponsored) Read more
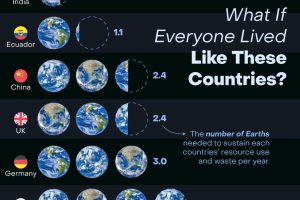
How many Earths would we need if the global population lived like Americans? This infographic answers this question and more. Read more
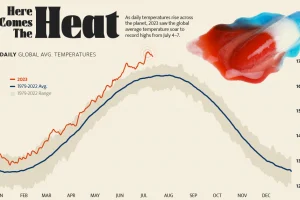
Four days straight in July 2023 set or equaled global temperature records on average. Read more