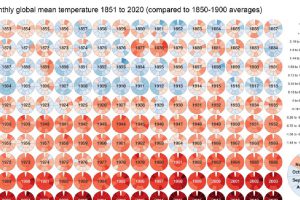
Global Temperature Graph (1851-2020) View the high-resolution of the infographic by clicking here. Since 1880, the Earth’s average surface temperature has risen by 0.07°C (0.13°F) every decade. That number alone… Read more

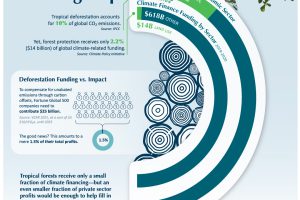
Deforestation accounts for 10% of global CO2 emissions, yet receives just a small slice of climate funding. See why closing this funding gap is necessary to combat climate change. (Sponsored) Read more

