

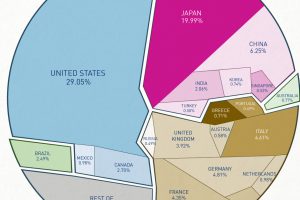
This data visualization shows total world debt by country and debt-to-GDP ratio. Read more
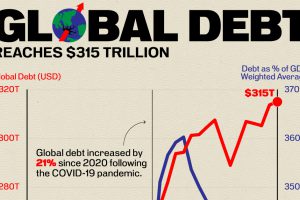
Global debt has soared to a new landmark, adding $1.3 trillion in debt in the first quarter of 2024 alone. Read more
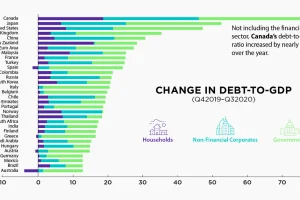
The battle against the COVID-19 pandemic has resulted in heightened debt-to-GDP levels across all sectors and countries. Read more
After an unprecedented borrowing spree in response to COVID-19, what does government debt look like around the world? Read more
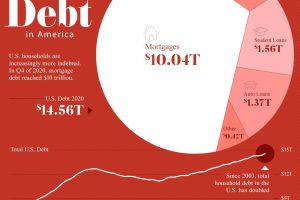
Since 2003, U.S. household debt has doubled to over $14.5 trillion. We break down the components of this colossal figure. Read more

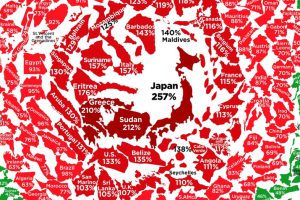
Global debt reached $226T by the end of 2020 – the biggest one-year jump since WWII. This graphic compares the debt-to-GDP ratio of various countries. Read more
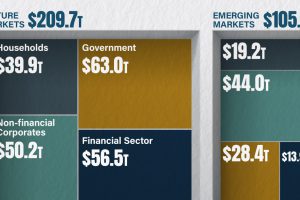
The world hit a new record of $315 trillion in global debt in Q1 2024. Which markets and sectors are leading this surge in debt? Read more
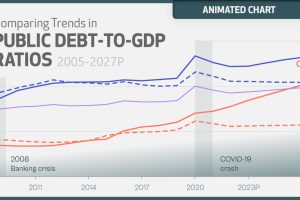
The surge in global debt poses significant risks to government balance sheets. Here’s where it’s projected to reach over the next five years. Read more
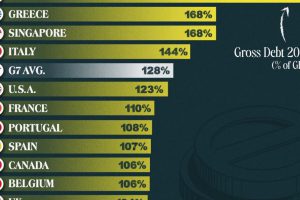
This graphic ranks government debt by country for advanced economies, using their gross debt-to-GDP ratio. Read more