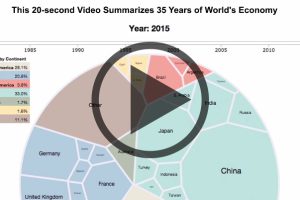
Watch the world economy evolve over 35 years in this video, which captures the breakdown of economic output by country. Read more

How busy are the world’s shipping routes, and where are the global chokepoints for commercial shipping? See every ship’s movement on this interactive map. Read more
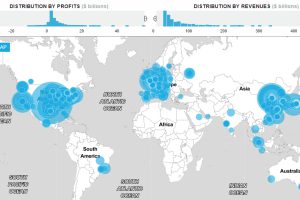
How has the list of the world’s largest companies by revenue changed over the last 20 years? See the rise and fall of the companies on the Fortune Global 500. Read more
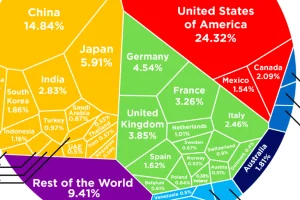
See how the multi-trillion dollar pie of the global economy gets divided between countries, based on the latest data from the World Bank from February 2017. Read more
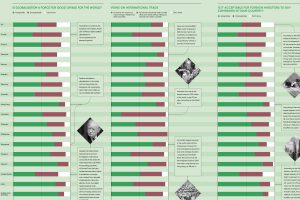
Is globalization a force for good or bad? The answer to this question depends greatly on who you ask – here is a survey of people in 19 countries. Read more
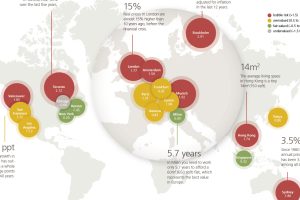
According to UBS, there are eight financial centers that are in bubble territory with real estate prices rising at potentially unsustainable rates. Read more
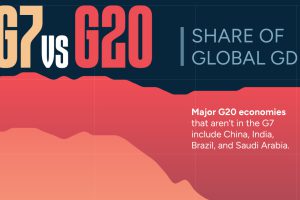
The G7’s share of global GDP has been shrinking since the early 2000s. See the full story in this infographic. Read more
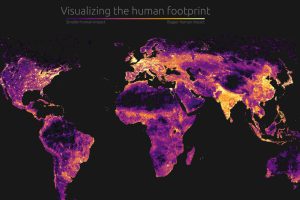
Our impact on the planet has been profound. Today’s graphic visualizes this human footprint by looking at population density, roads, undersea cables, and more. Read more
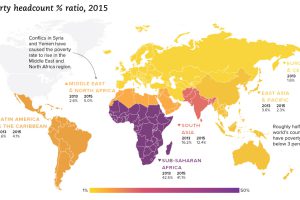
We look at the latest data from the World Bank, which reveals a drop in extreme poverty of 1 billion people globally since the year 1990. Read more
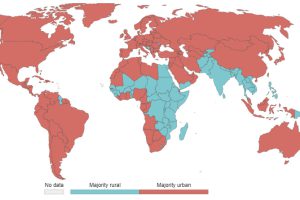
55% of the world lives in urban areas today. But what defines an urban population, and how will this big picture change by 2050? Read more

