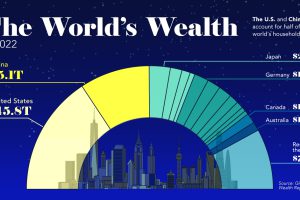
This visualization breaks down how household wealth is distributed around the world. Just 10 countries now account for 75% of total household wealth. Read more

Just five countries make up more than half of the global economy. The top 25 countries make up a staggering 84% of the world’s GDP. Read more
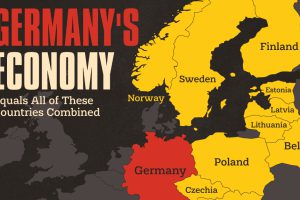
It takes Poland, Sweden, Austria, Norway, and 18 other countries together to match the might of Germany’s economy. Read more
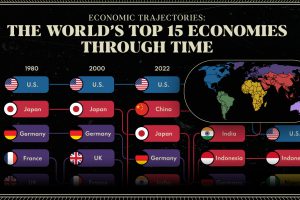
We provide a historical and predictive overview of the top economies in the world, including projections all the way to 2075. Read more
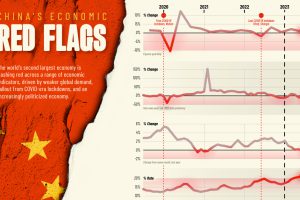
We chart six red flag indicators threatening China’s economy and it’s post-pandemic recovery, as well as global economic growth Read more
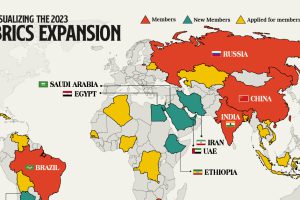
We provide a data-driven overview of how the recent BRICS expansion will grow the group’s influence and reach. Read more
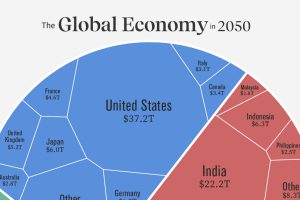
Asia is expected to represent the world’s largest share of real GDP in 2050. See how this all breaks down in one chart. Read more
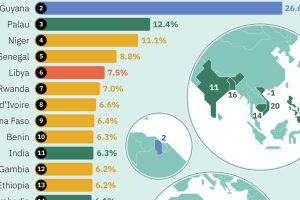
This graphic uses the latest IMF projections to rank the world’s top 20 fastest growing economies for 2024. Read more
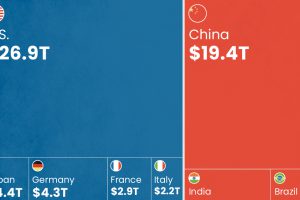
As BRICS is set to add six new countries, how does the bloc and its new members’ GDP compare with that of the G7? Read more

Services-producing industries account for the majority of U.S. GDP in 2023, followed by other private industries and the government. Read more

