

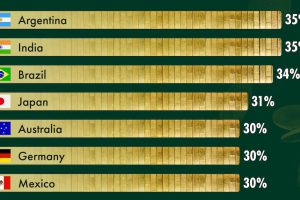
Interestingly, BRICS members cover the spectrum of corporate tax rates in the G20 from highest (India, Brazil) to lowest (Russia). Read more
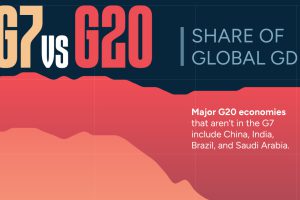
The G7’s share of global GDP has been shrinking since the early 2000s. See the full story in this infographic. Read more
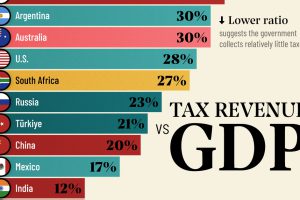
Measuring the ratio of tax revenue to economic size reveals the government’s ability to spend on public services. Read more
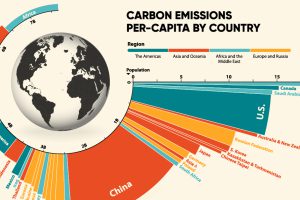
33.6 Gt of CO2 was emitted across the world in 2019. Here we visualize the global per capita CO2 emissions by country and region. Read more
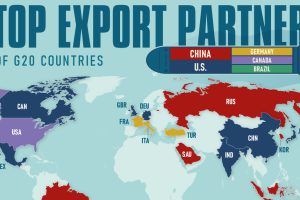
The U.S. and China were the top export markets for an equal number of G20 countries in 2022. But which countries were they? Read more

We round up the most popular, most discussed, and most liked visualizations of the month on Voronoi, our new data storytelling platform. Read more
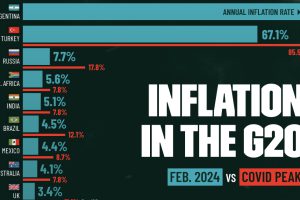
We visualize inflation rates across G20 countries as of Feb 2024, in the context of their COVID-19 pandemic peak. Read more