


Despite being the world’s biggest carbon emitter, China is also a key producer of most of the critical minerals for the green revolution. Read more
The current energy transition is unprecedented in both scale and speed. This infographic puts it into historical context. Read more
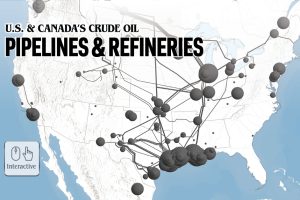
Explore North America’s crude oil pipelines and refineries across the U.S. and Canada in our interactive map. Read more
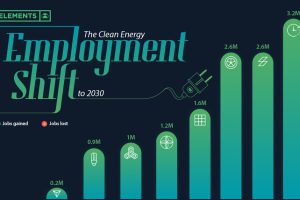
Will the clean energy transition create jobs, or will jobs be lost? Here is projected employment growth in clean energy and related sectors to 2030. Read more
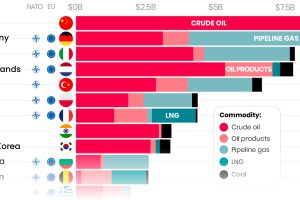
Here are the top importers of Russian fossil fuels since the start of the war. Read more
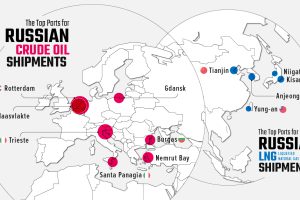
Russia’s energy exports have become a hot topic. See which ports received fossil shipments during the first 100 days of the Ukraine invasion Read more
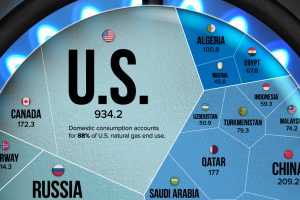
Natural gas prices have risen since Russia’s invasion of Ukraine. This visualization highlights the world’s largest natural gas producers. Read more
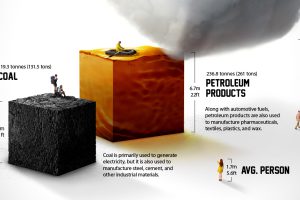
Each year the average American consumes more than 23 barrels of petroleum products. What does a lifetime of fossil fuel consumption look like? Read more
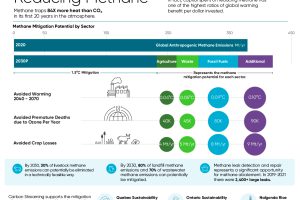
Methane emissions contribute to over half of net global warming. Where do the greatest opportunities lie for methane abatement? Read more
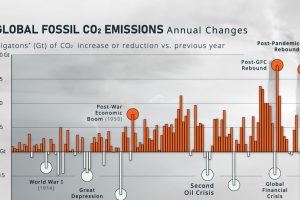
How much do global CO₂ emissions change on a year-to-year basis? Here, we show the annual rate of change in emissions since 1900. Read more