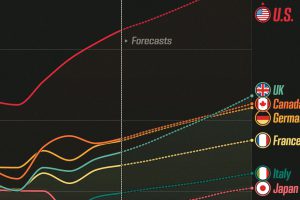
See how G7 economies are expected to perform in terms of GDP per capita, all the way to 2029. Read more
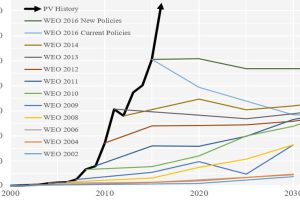
Forecasting the future of energy is not an easy task. These charts show how the experts have fared at forecasting solar over recent decades. Read more
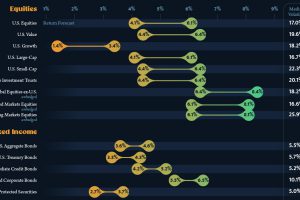
This infographic visualizes 10-year annualized forecasts for both equities and fixed income using data from Vanguard. Read more
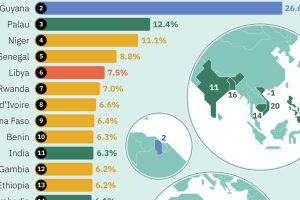
This graphic uses the latest IMF projections to rank the world’s top 20 fastest growing economies for 2024. Read more
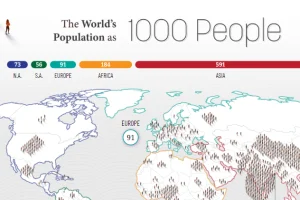
How would all the people in the world be spread out if there were only 1,000 people on Earth? This interactive map examines the breakdown. Read more

Last year, U.S. stocks took investors by surprise. This graphic shows S&P 500 historical returns since 1875 to put 2023 returns into context. Read more

