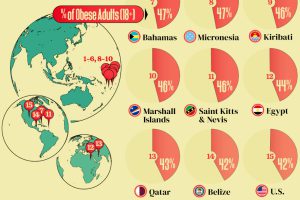
The U.S. ranks 15th in the highest adult obesity rates. Qatar and Egypt are the only other 1 million+ countries to feature. Read more
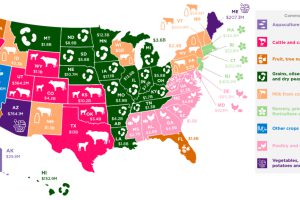
Which agricultural commodity is the most important to each state’s economy? This infographic breaks it all down, based on data from the USDA. Read more
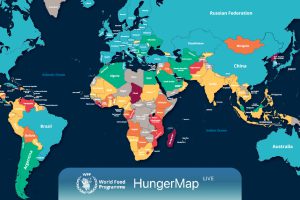
Every day, hunger affects more than 700 million people. This live map from the UN highlights where hunger is hitting hardest around the world. Read more
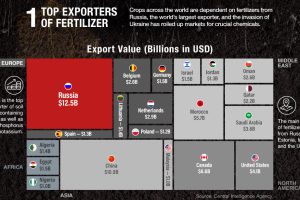
Bad weather, the war in Ukraine, and a shortage of fertilizer have led to fears of a global food crisis. Here are three factors you should know. Read more

Which foods are linked with high CO2 emissions and high water use? We look at the environmental impacts of food production in this chart. Read more
With nearly 180 bushels of corn grown per acre in 2023, this is the data behind the corny American love story. Read more
Growing the big four American crops—corn, soybean, hay, and wheat—require farmlands bigger than entire countries. Read more
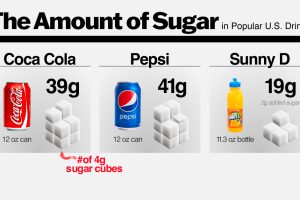
The average American consumes about 71g of sugar daily, over 2-3 times the recommended limit. Read more

