
In this graphic, we break down global salt production in 2023. China is currently the top producer, accounting for almost 20% of output. Read more
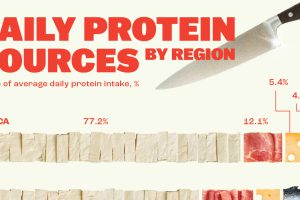
Here, we break down how people around the world get their protein intake. Read more
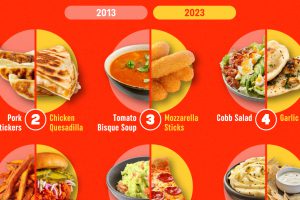
In 2013, the top 10 most-ordered takeout food on Doordash featured more varied cuisine compared to 2023. Read more
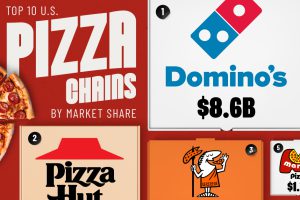
Domino’s is the biggest pizza chain in the U.S. by sales. Read more
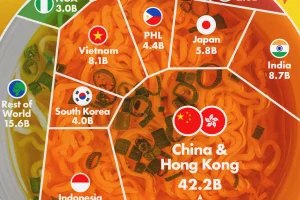
The top ranked country ate about 30 instant noodle servings per person in 2023, at a rate of slightly more than two helpings a month. Read more
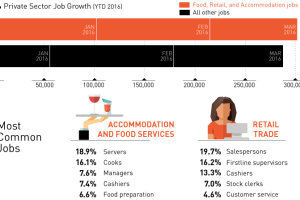
So far in 2016, a total of 589k private sector jobs have been created by the U.S. economy. However, 51% of these jobs are in two of the lowest paid… Read more
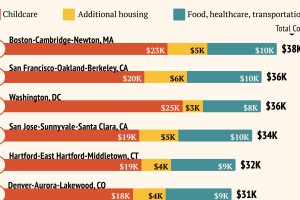
Raising a child in a large U.S. metro costs an average of $25k per year. Read more
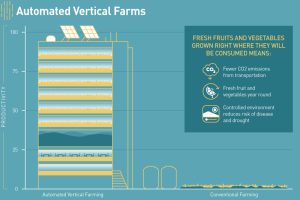
With a swelling global population, these 4 key food technologies will be vital for the future of food. We’ll get more food with fewer resources. Read more
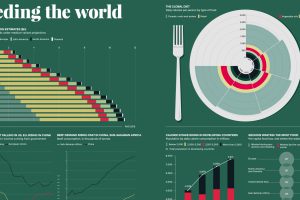
The global population will grow by billions in the coming years – but more importantly, the global diet is changing rapidly, as well. Read more
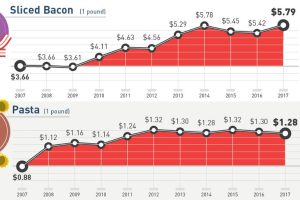
How much more expensive are basic staples than they were 10 years ago? This infographic tracks grocery prices for 30 common items like cheese, fruit, and eggs. Read more

