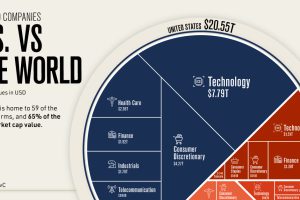
Where are the top 100 companies of the world located? We highlight the U.S. share of the top companies by market capitalization . Read more

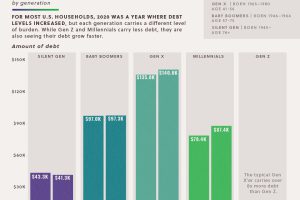
The majority of U.S. households saw debts rise in 2020. This data looks at the growth in household debt and the existing debt pile, by generation Read more

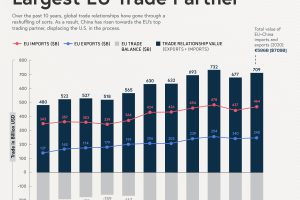
China has spearheaded its economy towards a global superpower, and as a result, has overtaken the U.S. as the EUs top trade partner Read more

Longer term serving CEOs are linked to superior stock price performance for the companies they oversee. Which CEOs are the longest serving today? Read more

Corporate finance oversees trillions of dollars and makes modern markets and economies possible, but who are the main players? Read more

This infographic ranks the 10 most valuable bank brands over the past five years (Spoiler: U.S. banks aren’t in the top four) Read more

Despite the looming uncertainty, members of Gen Z maintains an optimistic outlook about their financial future Read more

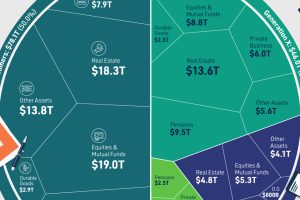
We’ve visualized data from the Federal Reserve to provide a comprehensive break down of U.S. assets by generation. Read more

Services-producing industries account for the majority of U.S. GDP in 2023, followed by other private industries and the government. Read more

In this graphic, we rank the top eight Bitcoin ETFs in the U.S. by their total assets under management (AUM). Read more

