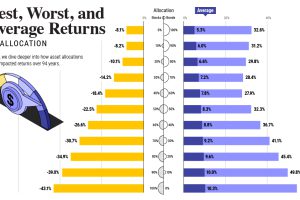
How have investment returns for different portfolio allocations of stocks and bonds compared over the last 90 years? Read more
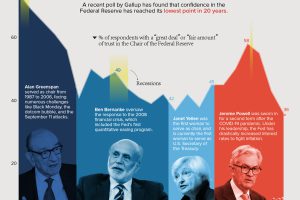
Public trust in the Federal Reserve chair has hit its lowest point in 20 years. Get the details in this infographic. Read more
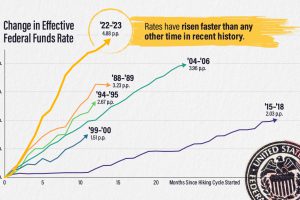
The effective federal funds rate has risen nearly five percentage points in 14 months, the fastest interest rate hikes in modern history. Read more
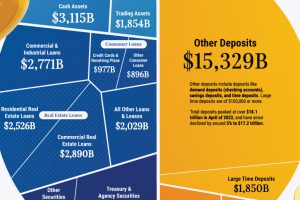
Banks play a crucial role in the U.S. economy, and understanding their balance sheets can offer insight into why they sometimes fail. Read more
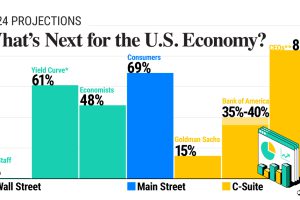
In this graphic, we show the probability of a U.S. recession in 2024, based on forecasts from Wall Street, Main Street, and the C-Suite. Read more
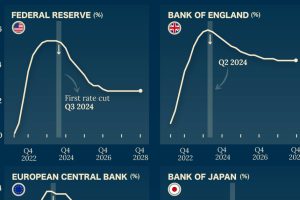
Which economies are expected to see interest rates rise, or fall? We highlight IMF forecasts for international interest rates through 2028. Read more

This graphic illustrates the amount of U.S. currency in circulation globally, by denomination, based on data from the Federal Reserve. Read more

U.S. debt interest payments have surged past the $1 trillion dollar mark, amid high interest rates and an ever-expanding debt burden. Read more


