

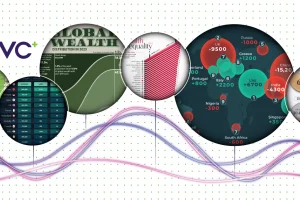
Our exclusive visual guide to the state of global wealth. Read more
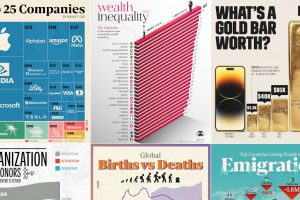
We round up the most popular, most discussed, and most liked visualizations of the month on Voronoi, our new data storytelling platform. Read more
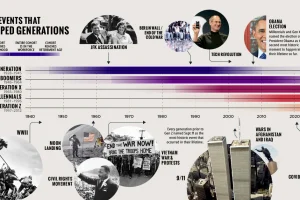
This timeline, from our Generational Power Index report, explores defining events in U.S. history that impacted each generation. Read more
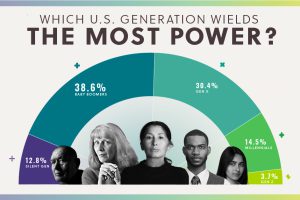
Using data from our new Generational Power Index, we look at how much economic, political, and cultural power each U.S. generation holds. Read more

The 100 biggest companies in the world were worth a record-breaking $31.7 trillion as of the end of Q1, up 48% year-over-year. Read more
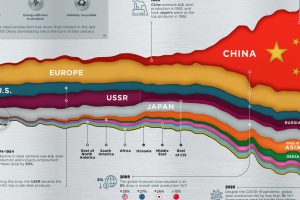
Global steel production has tripled over the past 50 years, with China’s steel production eclipsing the rest of the world. Read more
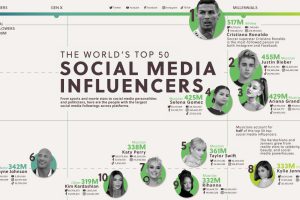
Which influencers have the most total social media followers? We tally up follower counts across all major platforms, from Twitter to TikTok. Read more
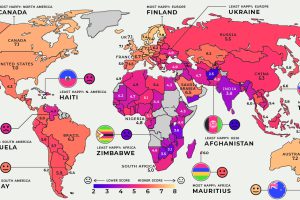
Global happiness levels are determined by many diverse factors. These maps look at the happiest and unhappiest countries in every region. Read more
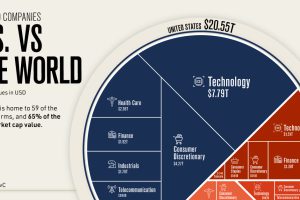
Where are the top 100 companies of the world located? We highlight the U.S. share of the top companies by market capitalization . Read more
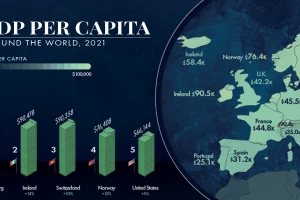
GDP per capita is one of the best measures of a country’s standard of living. This map showcases the GDP per capita in every country globally. Read more