In a complex world, the combined forces of data and visual communication take on new importance. See our top 20 visualizations for 2020. Read more

Visualizing the share of COVID-19 vaccines purchased by different countries and the companies that are manufacturing them. Read more

Use the powerful infographics, charts, and data visualizations created by Visual Capitalist to anchor your next story, publication, or report. Read more

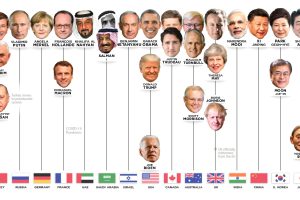
Who has led the world’s 15 most powerful countries over the last 50 years? This visual looks at world leaders from 1970 to today. Read more

It’s been a long year since the WHO declared the novel coronavirus a global pandemic. This visual looks at key events in the COVID-19 timeline. Read more

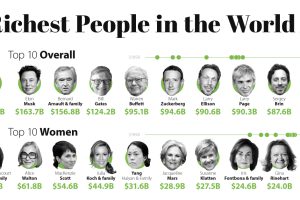
Among the uber-rich, just ten people amassed over $732 billion since the pandemic was declared. Who are the richest people in the world as of 2021? Read more

VC Elements is a brand new channel brought to you by Visual Capitalist which uses data-driven visuals to bridge the gap between the global trends shaping our future and the raw… Read more

The net worth of the 50 richest families in America combines for $1.2 trillion. Here’s how multi-generational family wealth stacks up in the country. Read more

Bitcoin mining requires significant amounts of energy, but what does this consumption look like when compared to countries and companies? Read more

What could happen after rates are cut? Find out in our exclusive visual guide to the markets in September. Read more

